YTD Category Development
The YTD analysis compares sales in a given category for the whole year in selected years.
Only the months whose data is present in all analysed years and at the same time only the months whose data is complete for the whole month are included in sales in a given category. This means that the analysis will not include for example October due to the fact that Quant has at its disposal data only till 20 October and the rest is missing. In addition, if in 2016 the data is available for December but in 2017 not, Quant will not include December in neither of the years.
In Year criteria, you have to select years to be compared.
If you select more Value Types in Criteria, more graphs will be shown next to each other. If you select as Value Types both Sold Pieces and GP1, the graphs for both features will be shown.
Calculated Shares Only from Analyzed Products
- Checkbox is marked
Only the categories selected in Criteria are regarded as a whole. This analysis will tell you what the share of sales in a given category in selected years in the sales of the categories selected in the criterion is.
- Checkbox is not marked
All categories in Quant are regarded as a whole. This analysis will tell you what the share of sales in a given category in selected years in all categories in Quant is.
Criteria that are not described in this manual can be found in the Basic Settings of Analysis manual.
Quant includes only the months whose data is present in all analysed years. Quant includes only the months whose data is complete for the whole month.
The YTD analysis is divided into 2 tabs: Results and Total.
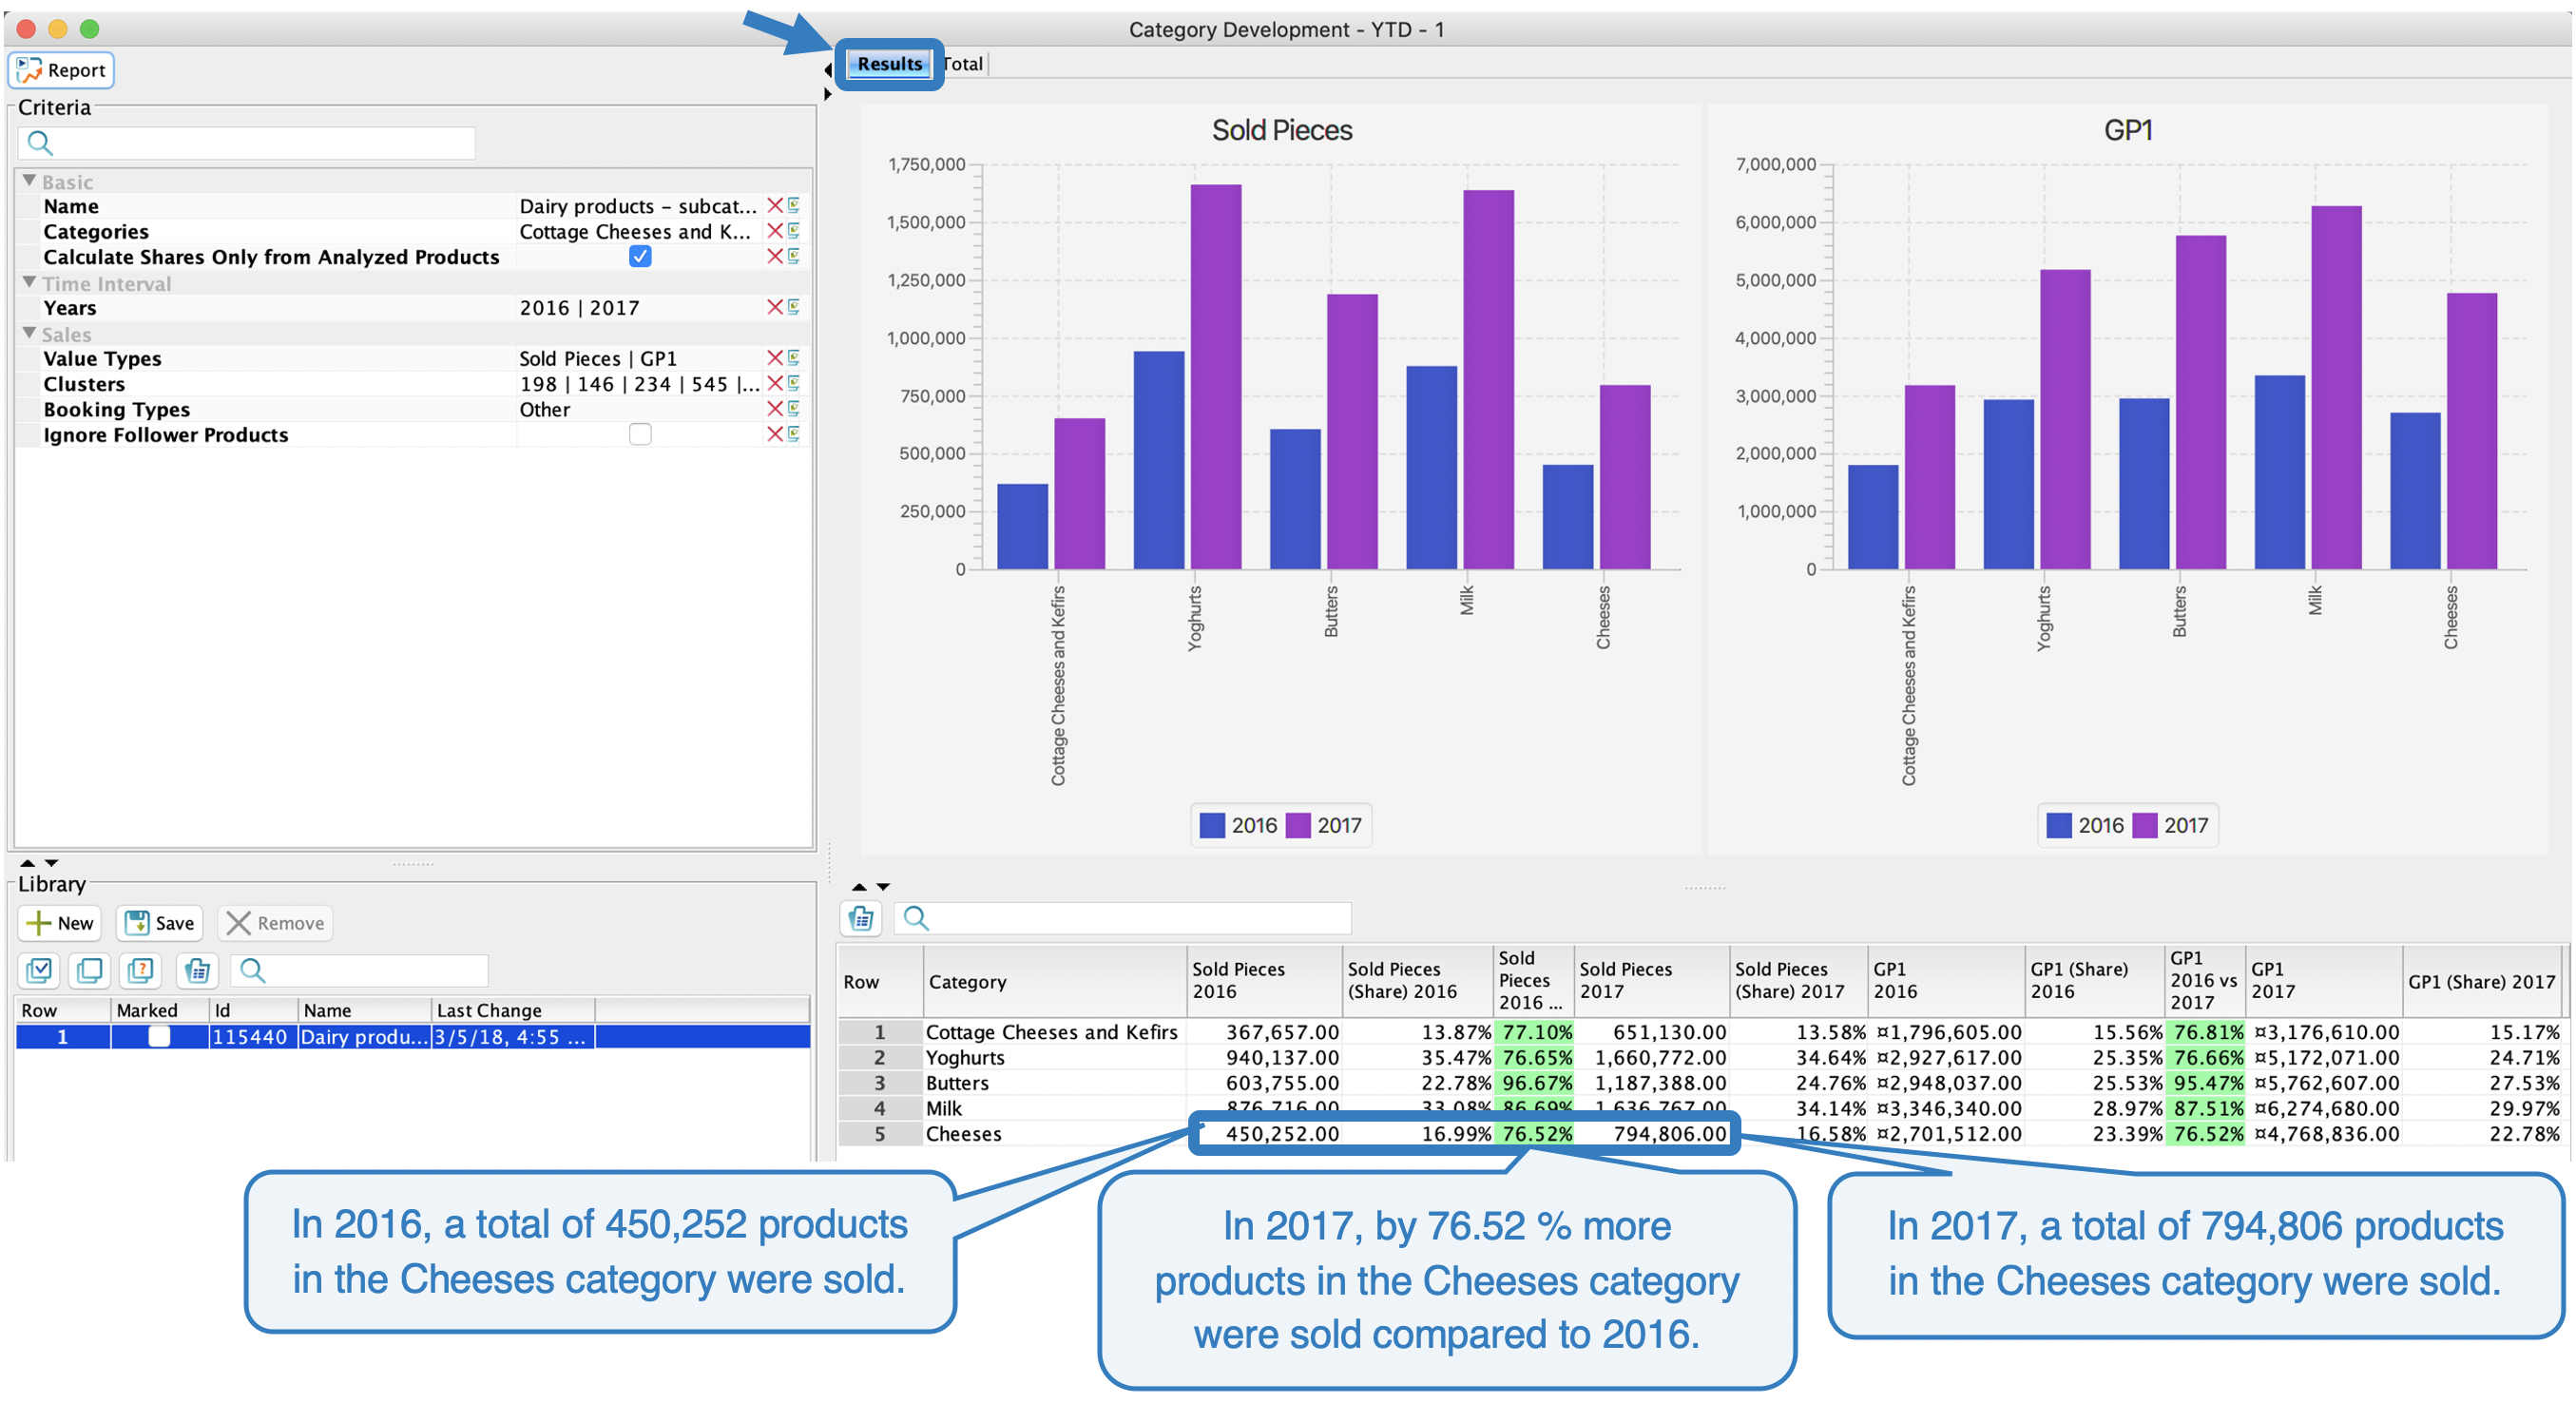
Results tab
The upper section shows the graphs comparing the sales of all selected categories in selected years.
The table below shows specific data concerning sales. The following explanation concerns the figure on the right.
In the column Sold Pieces 2016 (2017) you can see how many pieces of the given category were sold in 2016 (2017).
The column Sold Pieces 2016 vs 2017 includes the information on the percentage by which the number of pieces sold in 2017 compared to 2016 increased (a positive value) or decreased (a negative value).
The column Sold Pieces (Share) 2017 includes the calculated share of sold pieces of a category in the total sold pieces of products in all categories (in the case of the not selected checkbox Calculate Shares Only from Analysed Products) or products present only in the analysed categories (in the case of the selected checkbox Calculate Shares Only from Analysed Products).
 Results Tab Total tab
This tab always shows a total value for sold pieces (profit, revenues from sales) for the whole year.
Displayed values depend on the selection / non-selection of the checkbox Calculate Shares Only from Analysed Products:
- Check box is marked: accumulated values of only the categories selected in the Categories criterion will be displayed here.
- Check box is not marked: accumulated values for all categories in Quant will be displayed here.
In the figure the checkbox is selected, which means that the number of sold pieces and profit for all analysed categories will be displayed.