Case Study Iceland
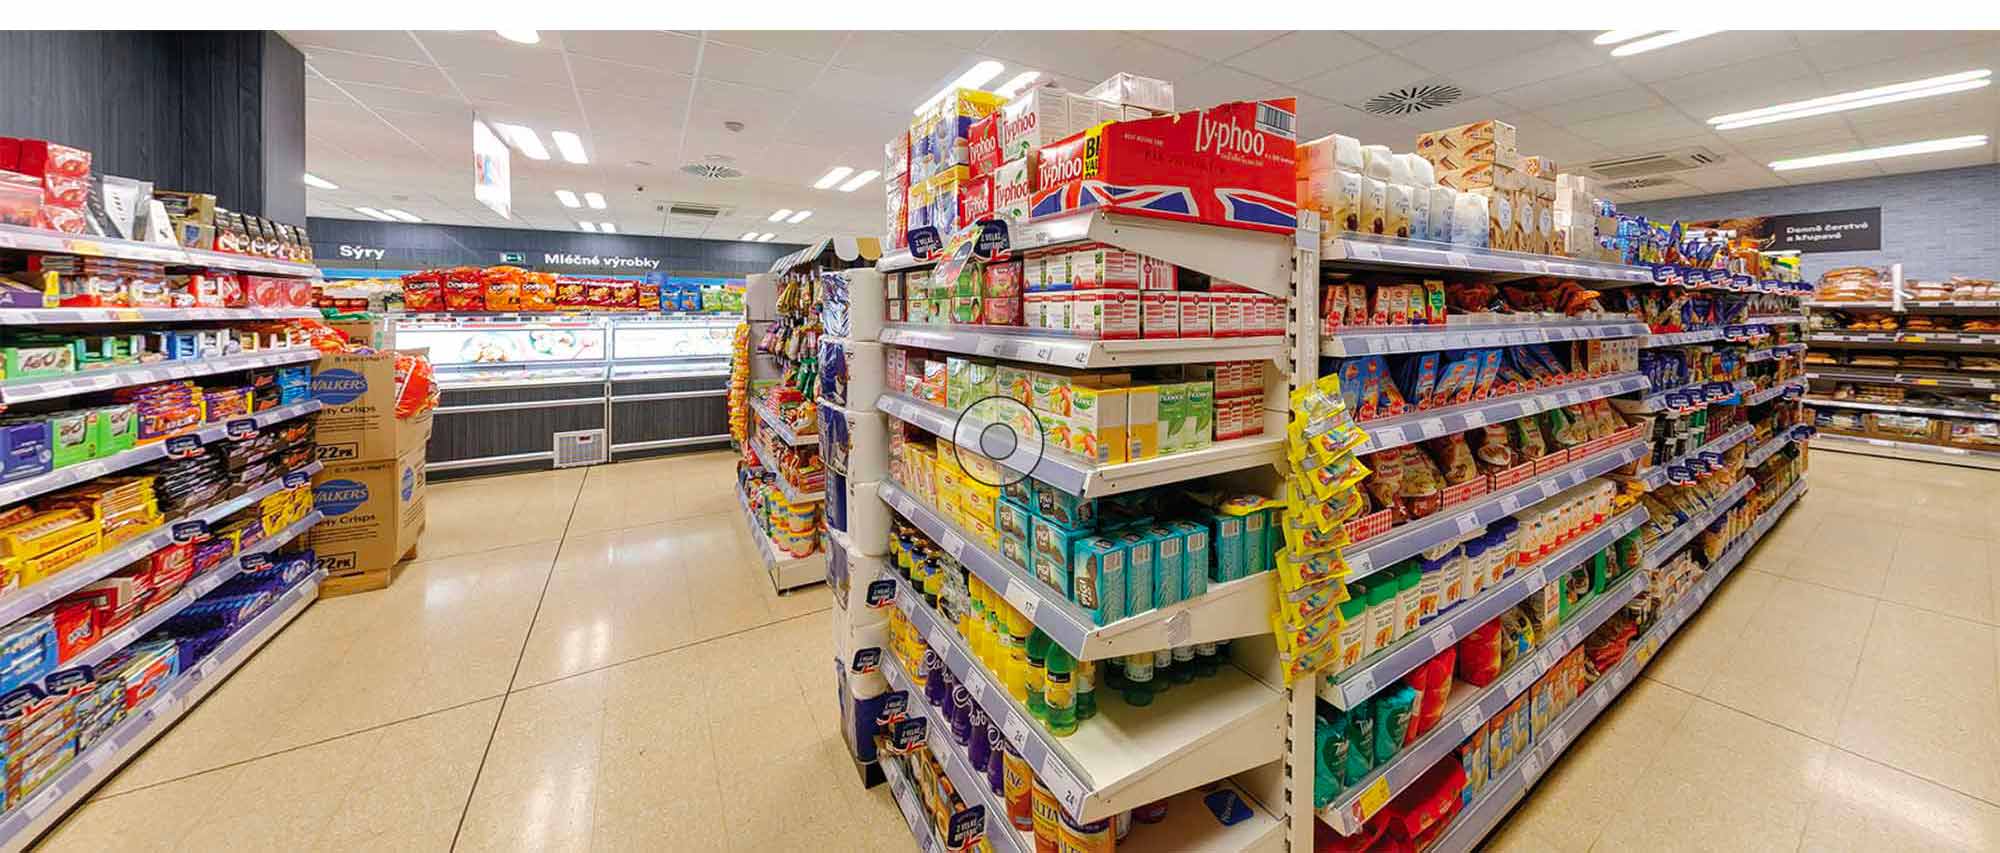
British food market with frozen goods
• Customer since 2018
• 11 stores
• 15,000 products in the database
Jana Pleskačová | Category Manager
What caused Iceland in the Czech Republic to decide to look for a planogram system and why did you choose Quant in the end?
Until 2018, we used planograms in Excel which was not a very practical solution. Due to the fact that we opened several other stores of various sizes, this situation was still unsustainable for us and we started looking for a more sophisticated solution.
We chose Quant because of the comprehensive solution for the entire process — support for product selection, store space planning, exhibition planning, easy implementation in stores. No unnecessary investments were required. Local support was also an important decision factor for us.
How did they manage to implement the system and what were the first benefits?
The first step for us was to go around all the stores and map the current layout of the range and shelving equipment. Subsequently, we created a library of shelving equipment and drew the layouts of all stores. Together with the purchasing team, we selected several pilot categories which we will draw first in Quant. This was followed by measuring and securing photos of products in selected categories.
At the same time, we worked with our IT department to connect the internal system to Quant so that we have up-to-date data. The most important information for us were sales prices, current stock, categories and a supplier.
After the publication of the first planograms in Quant, there was a training of all stores on how to work properly with planograms and the web application. We put the tablets into operation for the stores so they could take photos of the implemented planograms. Thus, printing is not necessary. We were very pleasantly surprised that this solution was perceived very positively by everyone.
How do you upload data to Quant? Was it possible to set up automatic data transfers between Quant and your ERP?
Interconnecting the systems was not complicated. We have defined which data we need to have available and in which columns. Transfers are automatic. We were provided with a manual which well described how to proceed (well-described file structure). CVS files are automatically generated from our system which are then automatically uploaded to Quant. We keep the dimensions of the products primarily in Quant and generate a file from it. It is automatically transferred to our system.
Do you use Quant web to publish planograms and communicate with stores?
Stores receive information by e-mail about which planograms are newly published on the website. If this is a bigger change, we publish a blog with additional information. We now also plan to have our internal Business News on the website. Our goal is to have all the information in one place with the possibility of tracing history.
Iceland stores are known for a large proportion of frozen goods. How do you manage to create planograms for this product?
We had to create a special library of equipment for these planograms because the products are not displayed classically on the shelves. We use the view from above; however, the creation of planograms is the same as for classic shelving equipment.
Do you also use Quant to manage marketing materials?
Not yet, but we plan to do so in the future.
What are your favorite reports and analyzes in Quant?
It is Product Development which we often use for Evaluation of Promotions, Store Stock, Out of Stock.
What was the biggest difficulty of the whole project?
To take away the freedom of stores that they cannot order the goods they would like. Nonetheless, everything is centrally controlled. We also have to teach them to order goods only from planograms.
Can you describe the main benefits of using Quant almost two years after its deployment?
All information is in one place. We have an overview of the division of categories in stores, the current range located on the planograms. We are able to make optimal use of the space in terms of the division of categories and we also define the capacity — how much goods will fit on the shelf. The display of goods has been simplified. We have a clearly defined space where the product is located and what quantity needs to be ordered.
We often have to update the planograms due to the unavailability of goods from the UK. Moreover, Quant enables us to simply exchange in-out items or tell stores information about the sale of items and subsequent replacement. When confirming the implementation of planograms, stores take photos of the finished planograms and we can check the correctness of the implementation or we eliminate problems.
What are your plans for the future?
Draw planograms for all categories, prepare the environment for automatic orders, use Quant for marketing, use the printing of price tags with a shelf address.
Product Development Analyze for Evaluation of Promotions and creating planograms for freezers and cooling baths.
A better overview of the division of categories in stores and of the current assortment placed in planograms.
Communication with stores via blog.
No paperwork required – implementation of planograms based on information in tablets.
Check of the planogram implementation thanks to photos uploaded by the store when confirming the implementation.