Placed Products Overview
Placed Products Overview allows you to analyse products placed in planograms or backstock products. This analysis gives you an overview of all products placed on planograms in the selected lifecycle state. This allows you to see which products are placed in the stores and in what quantities.
In what situation can you use the Placed Product Overview analysis?
- You need to know which products appear in the published planograms at the selected store or store group.
- Here you can see what products are placed in the template but not in the planogram.
- Here you can get a list of products from the backstock (the Backstock if Not Placed check box is checked).
- You want to see how many basic units or how many packages of the selected products are placed in planograms (numbers of units placed in width, height, depth or total).
- You want to find out how much space is taken up by the products placed in the planograms.
- You want to see if the product you selected is placed in a planogram.
An overview of placed products can be found in the menu Analysis - Placed Products Overview.
Placed Products Overview
Criteria settings
The first thing you need to do is to set the analysis criteria that will be used to display the results.
For a more detailed explanation of some of the criteria, see the Basic Settings of Analysis manual.
Name
Here you can fill in the name of the criteria.
Cumulation Level
Here you can set how to cumulate products in the report if they occur multiple times in the planogram:
- Block: If we have the same product block in one shelf twice, it will be displayed in the table on two rows and the number of displayed items will be displayed separately for each block.
- Shelf: If we have the same block of product in one shelf twice, it will be displayed in the table in one row only and the number of displayed pieces will be summed for both these blocks in one row. If this block was displayed further in another shelf or planogram, another row will appear in the table with this block and the number of units displayed for this position.
- Fixture: If we have the same product block in the first shelf twice and it also appears once in the second shelf in the same planogram, it will appear in one row in the table and the numbers of placed units will be summed for all these blocks in one row. If this block was also displayed in another planogram at this store, another row with this block and the number of displayed pieces for this position will appear in the table.
- Store: If we have the same product block in several different planograms at a given store in the table, it will appear in one row and the numbers of placed pieces will be summed for all these blocks in one row.
- State: If we have the same product block in several different stores and we are analyzing several stores at the same time, only one row with this product will be displayed in the table and the values for this product will be summed.
The product 108110 is placed on two prepared planograms of the Oxford store. On one planogram it has 3 different positions and on the other planogram it has only one position.
Planogram Example
Block
Shelf
Fixture
Store
Store 2
State
Products
Here you can check the products you want to analyse. If you leave the setting blank, all products are automatically analyzed.
We want to see if the selected product is located on the planogram. In this case, we will use the Products property to find this product. Then, after pressing the Report button, it will show whether the product is placed in the selected store in the planogram (it will appear in the report) or not (the report will be empty).
Product Filter
Here you can use rules to specify which products you want to include in the analysis. If you leave the checkbox unchecked, all products will automatically be analyzed.
Category
Here you can select the category whose products you want to analyse. If you leave the setting blank, all products are automatically analyzed.
Quant always analyzes the intersection of products set in the Products, Product Filter and Category criteria.
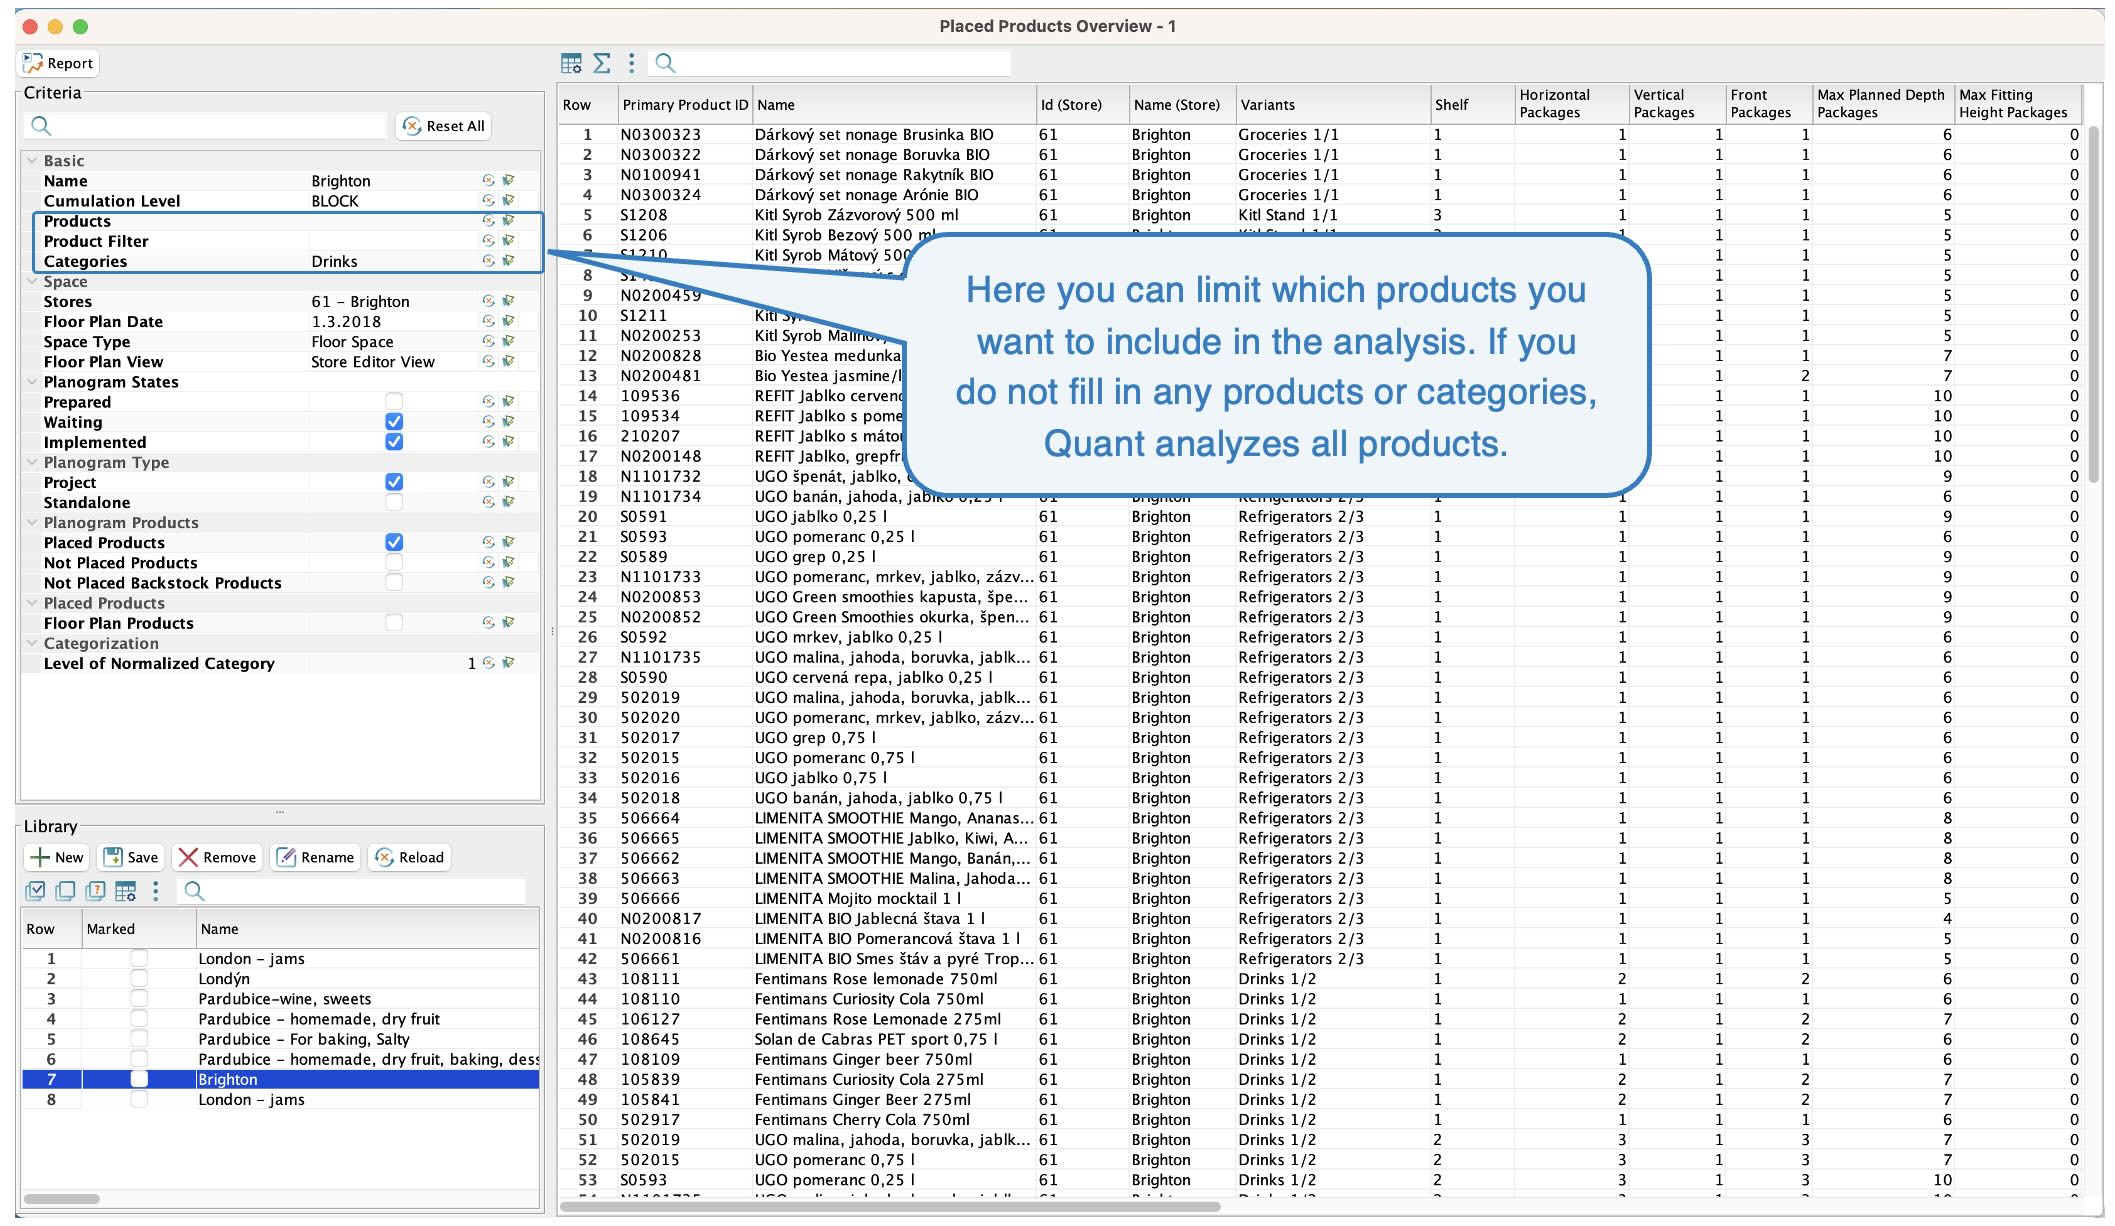 Products, Product Filter and Categories
Stores
Select which stores or store groups to analyse from the selection.
Floor Plan Date
In the Store Editor, layer versions are created and set to start. By the time this date is reached, the old version of the layer is no longer valid and the new one starts. For this reason, you can choose on which date the store space is to be analyzed.
Floor Plan View
In Quant, you can set a layer or fixture type to be hidden in the Project Editor, Product View, or Marketing View.
You can then select from the options in the analyses to determine which fixtures to analyze. The view in the Store Editor always includes all fixtures. If you do not use this setting, you can select any floor plan view.
Planogram States - Prepared, Waiting, Implemented
Here, select the state of the planograms to be analyzed. Quant will then list in the report the products that are in the planograms in the life cycle state selected here.
If you analyze both waiting and implemented planograms and the planogram is in both of these states, the products placed in the waiting planogram are always displayed. This gives you an overview of the products that the store will have displayed after all waiting planograms have been implemented.
Planogram Type - Project, Standalone
Select here whether you want to analyze only planograms from the project or only individual planograms or all planograms.
Project, Standalone
Planogram Products
- Placed Products: In the report Quant lists the products that are placed in the planograms.
- Not Placed Products: For example, these may be products that did not fit in the planogram or have low sales, or are not placed in the planogram because the store has them in the backstock. In the report you can then see the reason why the product was not placed in the column Not Placed Reasons.
- Not Placed Backstock Products: Quant lists products from the backstock that are not placed in planograms in the report. These products are placed in the templates and the property Backstock if Not Placed is checked.
Products in Planograms
Floor Plan Products
Quant will also include products that are placed directly in the floor plan in the report. These may be large products that are not displayed on shelves (e.g. large furniture).
Level of Normalized Category
There may be different levels of categories assigned to fixtures on the floor plan, but sometimes we want to see categories from the same level when analyzing. This is done by setting the Level od Normalized Category criterion. This determines which category level to display in the Normalized Shelf Category Id, Normalized Shelf Category External Id, and Normalized Shelf Category columns.Level of Normalized Category
After all criteria are set, click Report.
Analysis Interpretation
The Placed Products Overview analyzes the products selected in the criteria at the selected stores. If any of these products are placed (or not placed according to the settings in the criteria) on the published planogram of the selected lifecycle state at that store, they appear in the report. You can then see for all products in the table, for example, how many of these products are placed in the planogram, how much space they take up, etc.
Each row of the table represents one product.
To easily find out which planogram a product is placed in, click on the Details button. This function is only available for Block, Shelf and Fixture cumulation.
Details button
You can customize the table to best suit your needs. You can remove columns that you don't need to see, you can move important columns to the front, you can add some columns, etc. You can add many product and store attributes to the table.
In the following section you will find a description of the most commonly used attributes.
- Shelf Number: The shelf number on which the product is placed.
- Location Number: What is the position of this product in the whole planogram.
- Shelf Position: What is the position of this product on the shelf.
- Linear Space: The width of the space that products fill on the shelf.
- Width x Height: The space in m2 taken by the products in width and height.
- Width x depth: The space in m2 taken by the products in width and depth.
- Width x height x depth: The space in m3 taken by the products in width, height and depth.
Not Placed: If the checkbox is checked, the product is placed in the planogram template, but not placed in the planogram (it is crossed out in the template).
Backstock: If the box is checked, the product is in the backstock and is not displayed. The product has the Backstock if Not Placed box checked on the block in case it is not placed.
Prevent Planogram Placement: If checked, the product has the Prevent Planogram Placement box checked on the block.
Not Placed Reasons: This attribute displays the reason for not placing the product.
Min Planned Width Packages: The minimum number of packages planned to be placed in width (side by side). This is the minimum set on the block for the package.
Max Planned Width Packages: The maximum number of packages planned to be placed in width (side by side) = the number of packages actually placed in width in the planogram.
Min Planned Height Packages: The minimum number of packages planned to be placed in height (one above the other). This is the minimum set on the block for the package.
Max Planned Height Packages: The maximum number of packages planned to be placed in height (one above the other) = the number of packages actually placed in height in the planogram.
Min Planned Front Packages: The minimum number of packages planned to be placed in front = number of packages side by side x number of packages one above the other. These are the width and height minimums set on the block for the package.
Max Planned Front Packages: The maximum number of packages planned to be placed in front = the number of packages actually placed side by side x one above the other.
Min Planned Depth Packages: The minimum number of packages planned to be placed in depth (behind each other). This is the minimum set on the block for the package.
Max Planned Depth Packages: The maximum number of packages planned to be placed in depth (behind each other) = the number of packages actually placed in depth in the planogram.
Min Planned Packages Total: The minimum number of packages planned to be placed in total (width x height x depth). This is the minimum set on the block for the package (min width x min height x min depth).
Max Planned Packages Total: How many packages in total are actually placed in the planogram.
Max Fitting Height Packages: How many packages of this product can fit in the shelf in which the package is placed, in height.
Max Fitting Depth Packages: How many packages of this product will fit in the shelf in which the package is placed, in depth.
Max Fitting Packages: What is the maximum capacity of the shelf in which the package is placed if the number of front packages remains the same. Calculation: Front Packages x Max Fitting Depth Packages.
Packages Shelf Capacity: What is the maximum shelf capacity if the number of packages displayed in width remains the same. Calculation: Horizontal Packages x Max Fitting Height Packages x Max Fitting Depth Packages.
Min Planned Basic Units Wide: The minimum number of units planned to be displayed in width (side by side). This is the minimum set on the block for the product.
Max Planned Basic Units Wide: The maximum number of units planned to be placed in width (side by side) = the number of pieces actually placed in width in the planogram.
Min Planned Basic Units Front: The minimum number of units planned to be placed in front (width x height). This is the minimum set on the block for the product (min width x min height).
Max Planned Basic Units Front: The maximum number of units planned to be placed in front (in width x height) = the number of pieces actually placed in front in the planogram.
Min Planned Basic Units: The minimum number of units planned to be placed in total (width x height x depth). This is the minimum set on the block for the product (min width x min height x min depth).
Max Planned Basic Units: The maximum number of units planned to be placed in total (in width x in height x in depth) = number of pieces actually placed in the planogram in total.
Max Fitting Basic Units: What is the maximum capacity of the shelf in which the product is placed if the placed front basic units remains the same
Basic Units Shelf Capacity: What is the maximum capacity of the shelf if the placed horizontal basic units remains the same.
Displayed product in the planogram and its settings on the block
Min Planned
Max Planned and Max Capacity
Max Fitting Basic Units and Basic Units Shelf Capacity
The columns relating to packages and basic units show the same information, but where they relate to the package column, a package that may contain more than one basic unit is taken into account. For example, a family package of 4 yoghurts. If you do not use packages in Quant, each package automatically has only 1 basic unit and then these columns will display the same value.
Some columns may not be present in the table at all because they cannot be displayed for the selected Cumulation Level. For example, Shelf number column will be displayed when the Shelf and Block cumulation level is selected.