Sales Data Settings for Standalone Planograms
Sales data is an essential part required for the correct optimization of planograms. Thanks to planograms optimized according to sales, you can increase profit from sales in your stores.
In this manual, you can find a description of where and how sales data for a standalone planogram can be set.
First, you need to configure the sales data settings. You can configure sales data in Quant Explorer under the Sales Data Sets / Planogram Sales section. This section serves as a library where you can save all possible sales data configurations that you want to use for planogram optimization.
Configuration of Planogram Sales Data Settings in Quant ExplorerNext, you must always select which sales data settings configuration from the library you want to apply to a specific planogram. Sales data for a planogram is set in the planogram properties in the Planogram Editor:
Sales Data Settings in the Planogram Editor
Or directly in Quant Explorer in the Standalone Planograms section:
Sales Data Settings in Quant Explorer
Sales Data Settings
Benchmark Sales Data Sets
Benchmark Sales Data Sets are the sets based on which you wish a benchmark to be calculated. Then the average values of such clusters can be monitored and compared to, for example, store-specific sales. They will help you find out whether the store's results are better or worse compared to the average.
Booking Types
The booking type option specifies the method by which the product was sold – whether it was sold, for example, on prescription (at pharmacies), over the counter or ordered via e-shop. If you distinguish individual booking types, then you can decide to use only some of them for the needs of calculations and analyses in the project. If you do not upload any data concerning booking type to Quant, select the Other option.
Even if you do not distinguish Booking Types, you must still select the Other option in this criterion. If you don't do this, no sales data will be displayed in the Planogram Editor (only zeros will be shown in the sales data columns).
Sold Units Value Type
If you want to use sales data imported as a custom product attribute to optimize your planogram, you can select it here.
Value Types
Here, the value types that you wish to monitor in the Planogram Editor should be selected. This criterion defines columns displayed in product tables that will be available for the preparation of planograms.
Use Store Sales when Available
This checkbox is to be selected if you wish to have planograms optimized based on sales data from specific stores.
With every planogram, you will see sales data for the store for which the respective planogram has been created. In the pictures you can see the comparison of sales for product with ID N200309 in the Oxford and Nottingham stores for the year 2024. If the checkbox “Use Store Sales when Available” is selected, the planograms will be optimized according to this store-specific data.
Calculate Average Sales Data Set
Here, you can select whether you wish the columns of the product tables to display the average value for one store or the aggregate value for all sales data sets selected in Benchmark Sales Data Sets.
This setting affects both columns labeled (Benchmark) and columns labeled (Store).
“Calculate Average Sales Data Set” checked:In the table columns, the average value for one store (one sales data set) will always be displayed. In this case, the Benchmark Sales Data Sets criterion includes 26 selected data sets, which means that the total value of all sold pieces is to be divided by 26.– Sold pieces in all benchmark stores = 7064 pieces– Sold pieces (Benchmark) = 7064 / 26 = 271,69 pieces
“Calculate Average Sales Data Set” unchecked:In columns indicated as (Benchmark), the accumulated value of sales for all stores (data sets) included in the Benchmark Sales Data Sets criterion will be displayed.
– Sold pieces in all stores = 7064 pieces
Calculate Average Days / Number of Average Days
You can convert sales data into average sales for a certain number of days. If this setting isn't used, sales for the entire period that has been set in the Sales Time Range will be displayed.
You want to find out the average sales of products for a month (30 days).
– Check the “Calculate Average Days” checkbox
– Number of Average Days = 30
Ignore Follower Products
Products are sometimes set as followers in Quant. This setting is used if one product is being phased out and replaced by a new product. In this case it is advisable to use the predecessor's sales history to count the sales of the new product together with the sales of the previous one to make it easier to assess how well the new product will sell. With store-specific planograms Quant will not phase out the product from the planogram due to low sales as the product has no sales history. If you wish the sales history for predecessors or followers to be ignored, you can select the “Ignore Follower Products” checkbox. If you do not use predecessors and followers in Quant, you may ignore this checkbox completely.
Sales Time Range
This setting defines the period from which sales data of products should be taken.
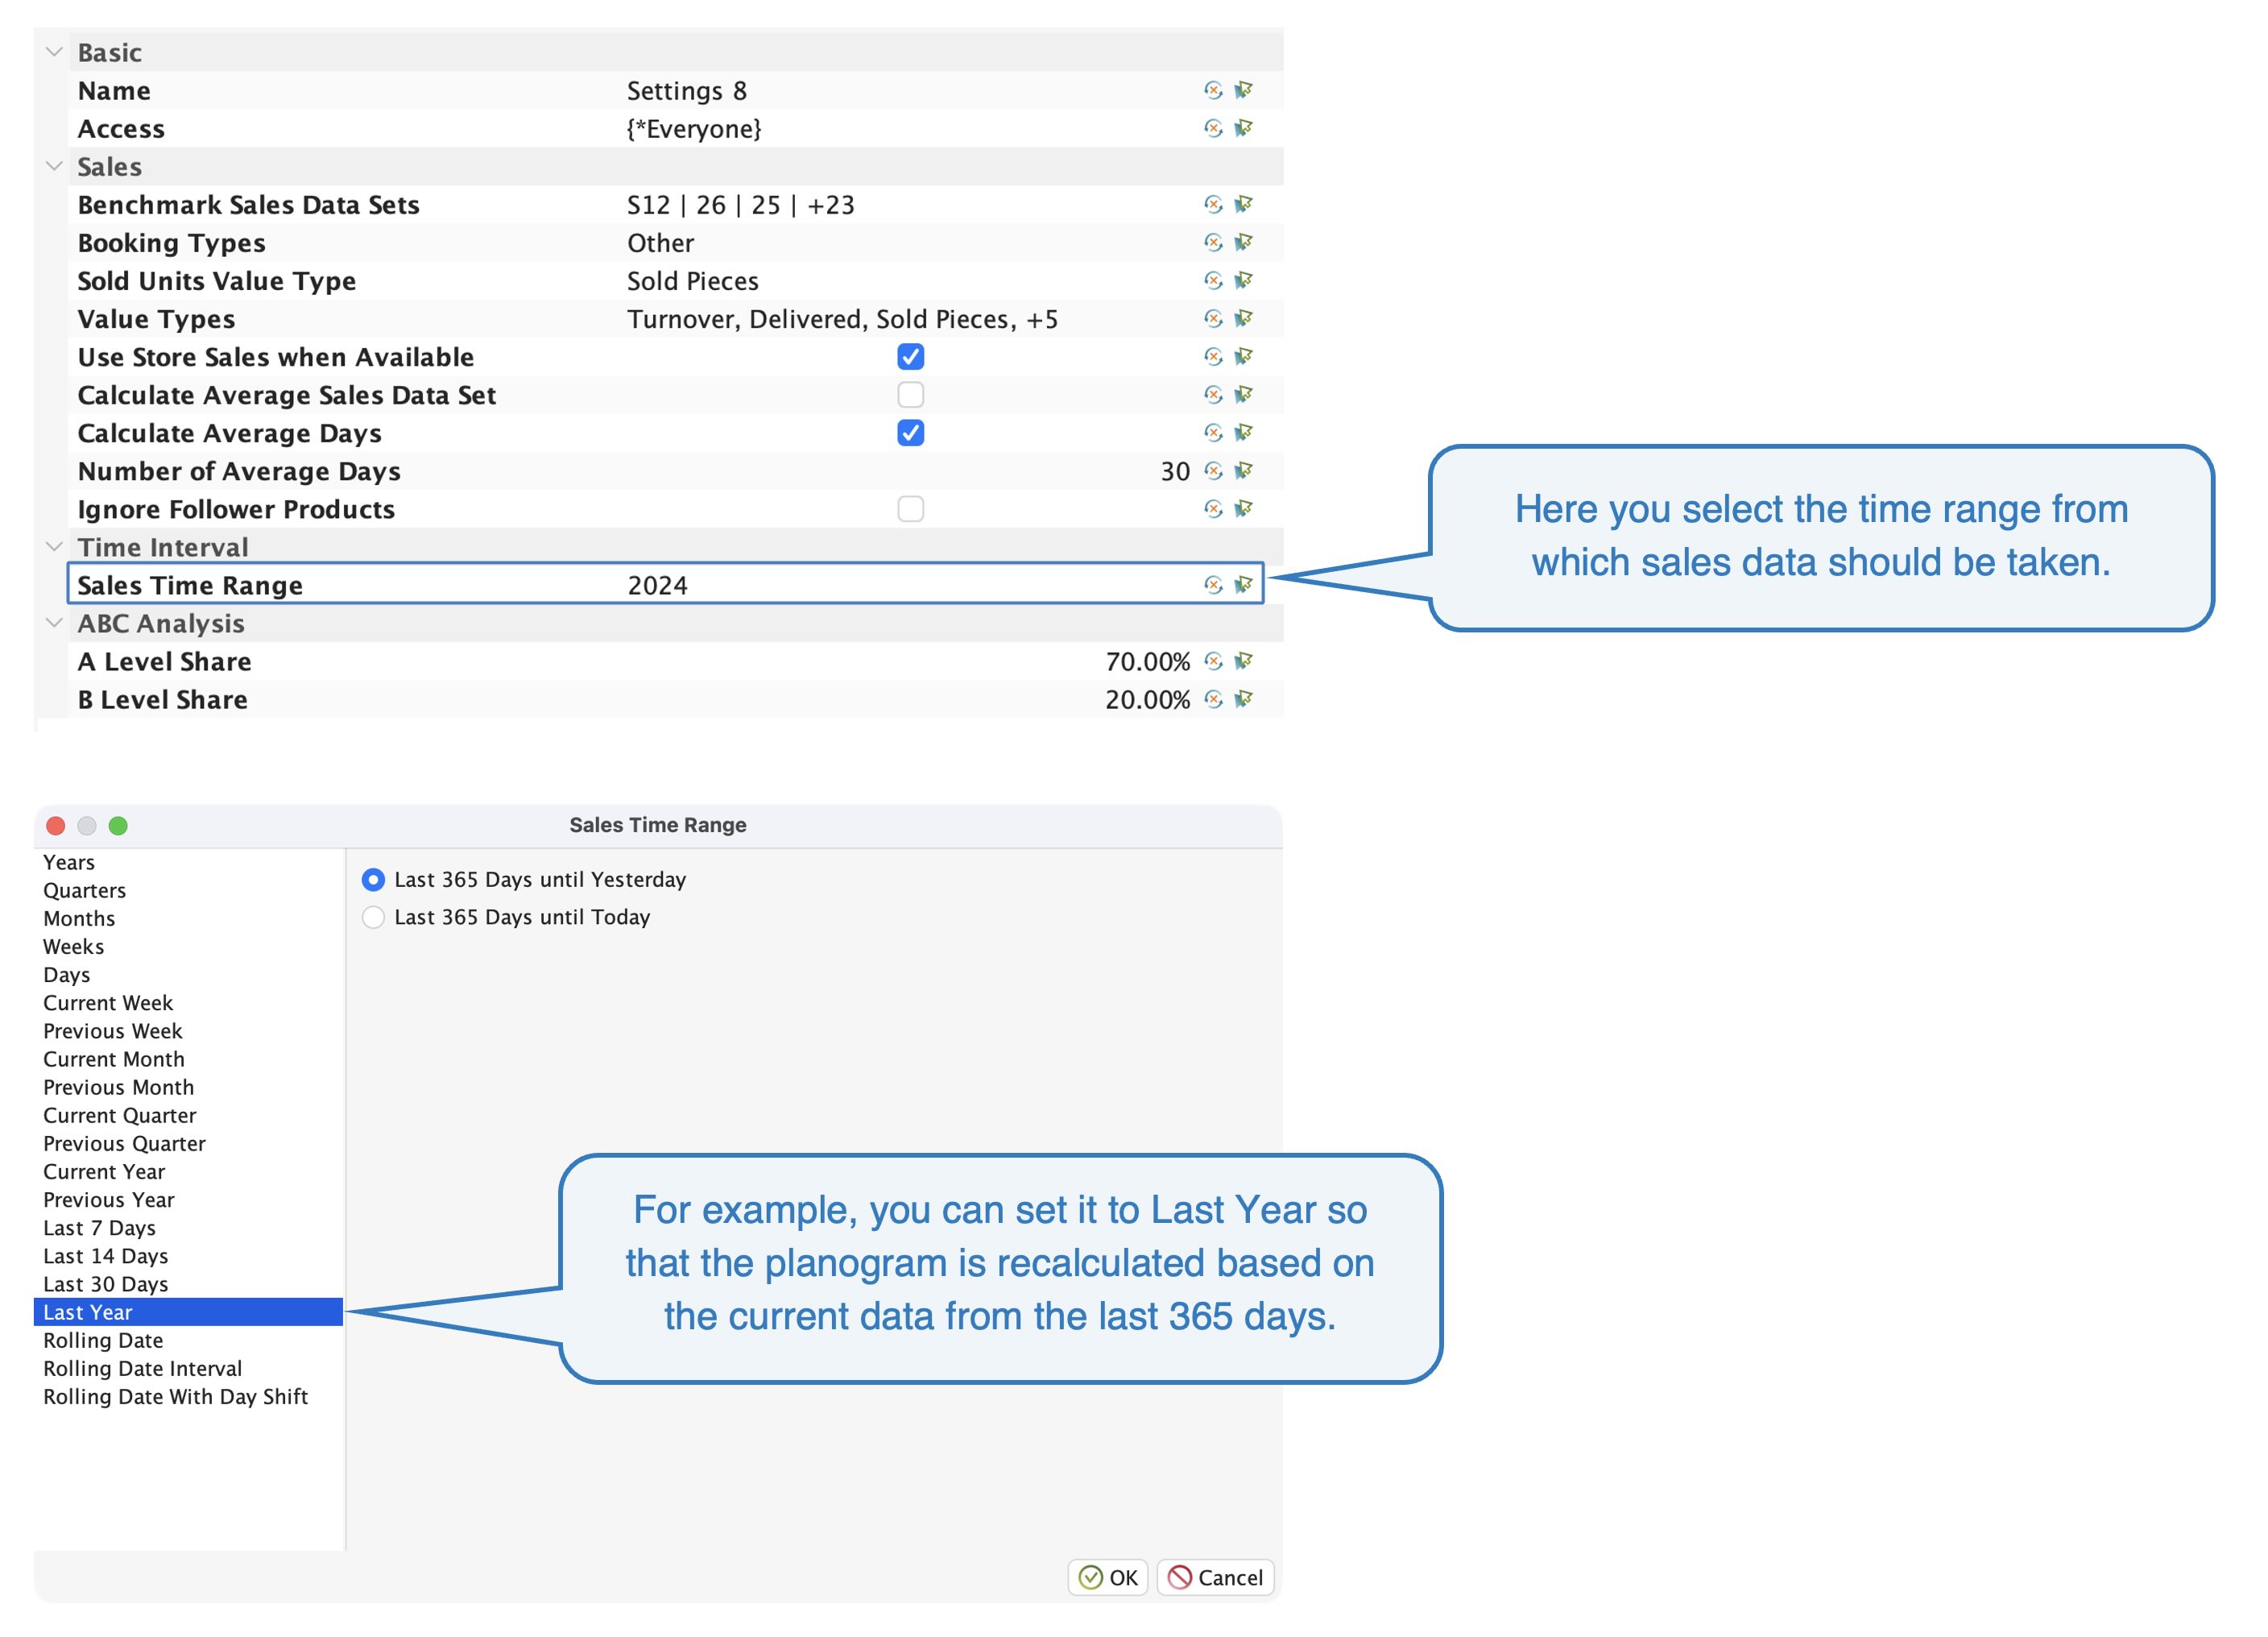 Setting the Sales Time Range
It is advisable to set this period so that you always work with sales data from the last few months. We also recommend to choose a period of 6–12 months, depending on how you want to take seasonal changes in sales into account.
ABC Analysis
In the sales data settings, criteria for the evaluation of products based on the ABC Analysis are set as well. Here, two criteria can be found:
- A Level Share = a limit for the top products in the category
- B Level Share = a limit for the second top group of products
The example described in the figures analyses products based on the ABC Analysis in terms of the number of pieces sold. In general, the ABC Analysis is available for every sales value monitored in the project. Results of the ABC Analysis can also be seen in columns designated as (ABC).