The correct placement of products in space is one of the most important factors influencing purchasing decisions and customer experience.

Retail space planning is not always an easy task. However, if you do not have a good plan which defines the direction of the client or the specific positions of the products on display, there is a risk that you will not use the existing potential to the fullest and adversely affect not only sales, but also customer experience and satisfaction.

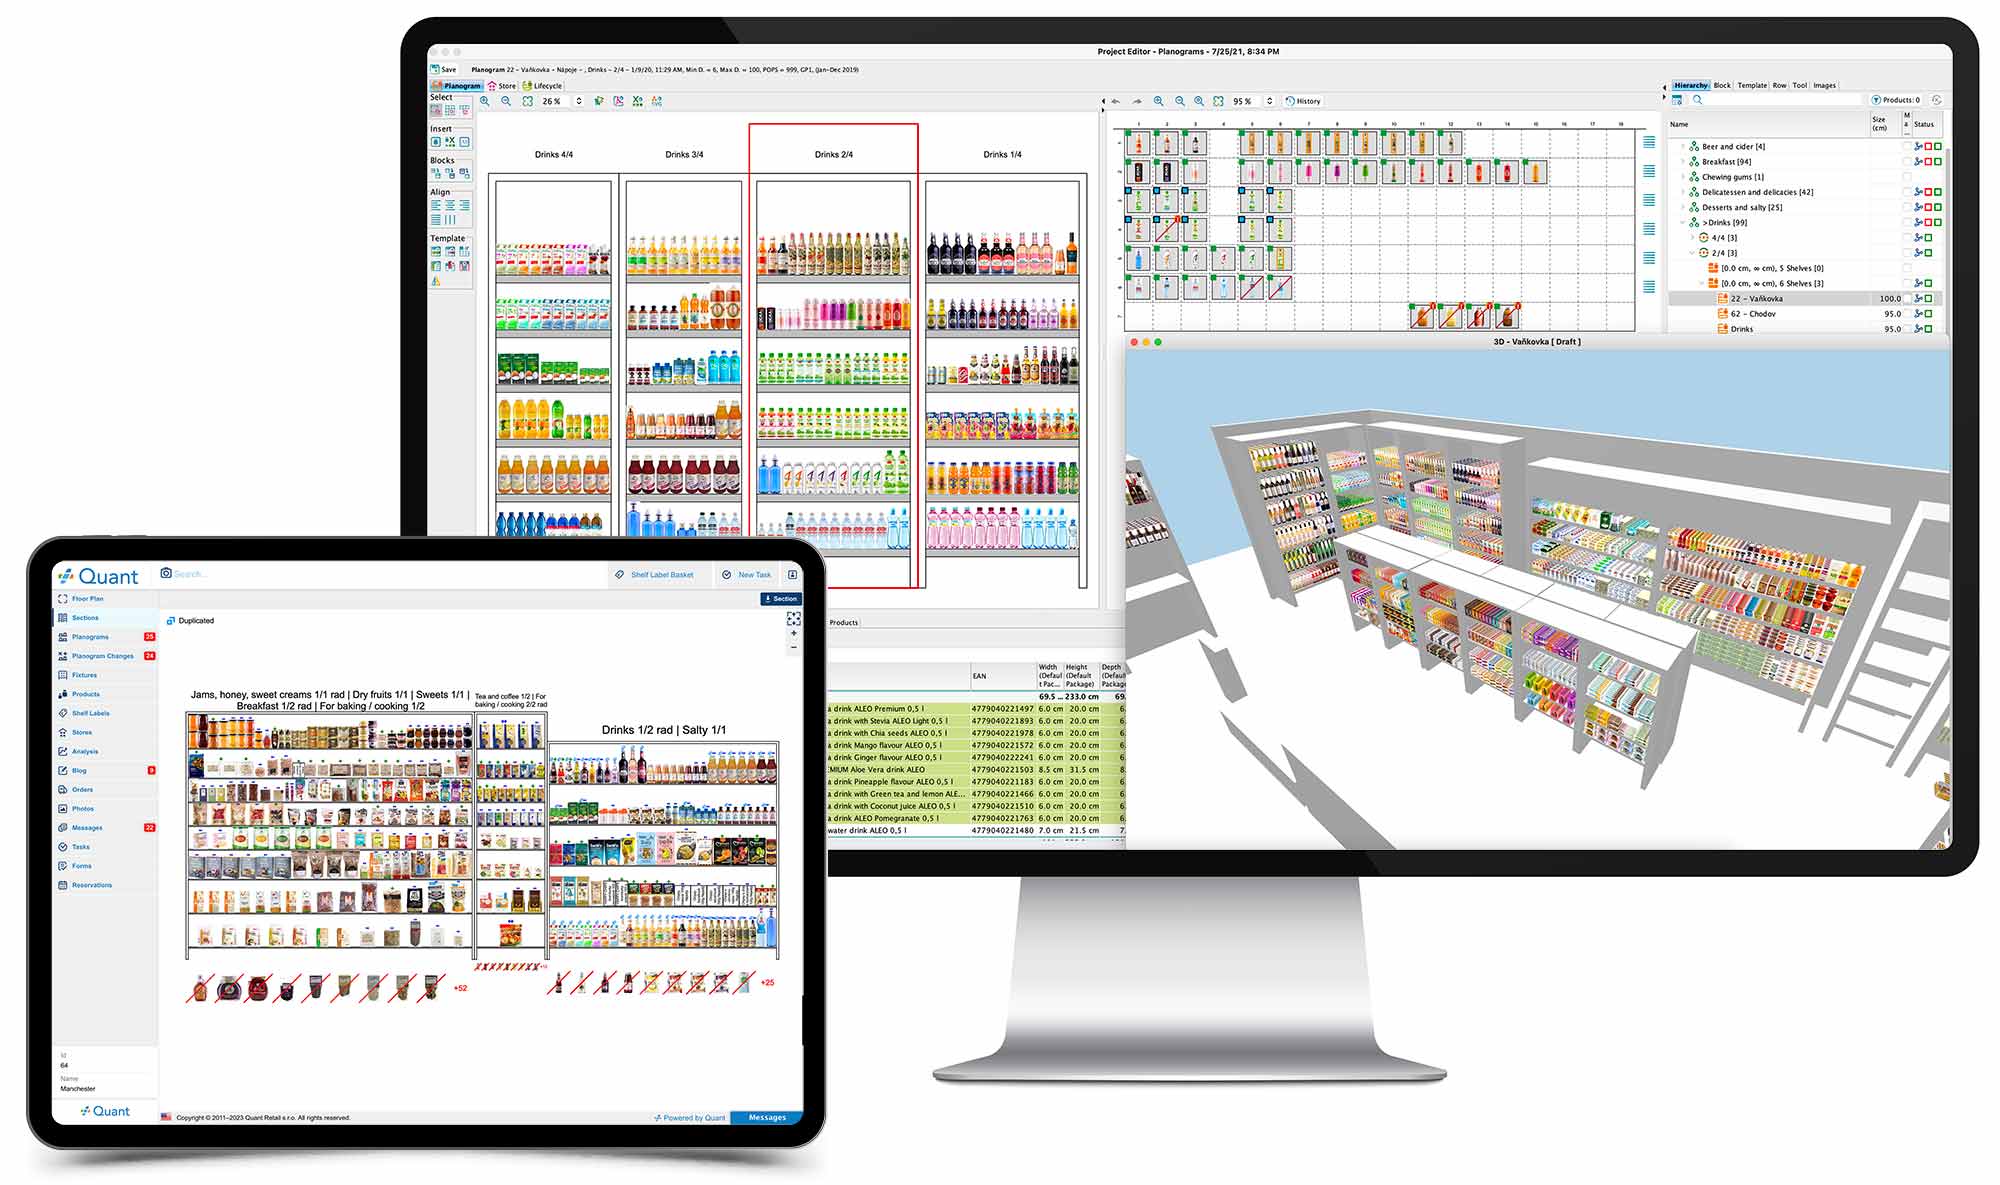
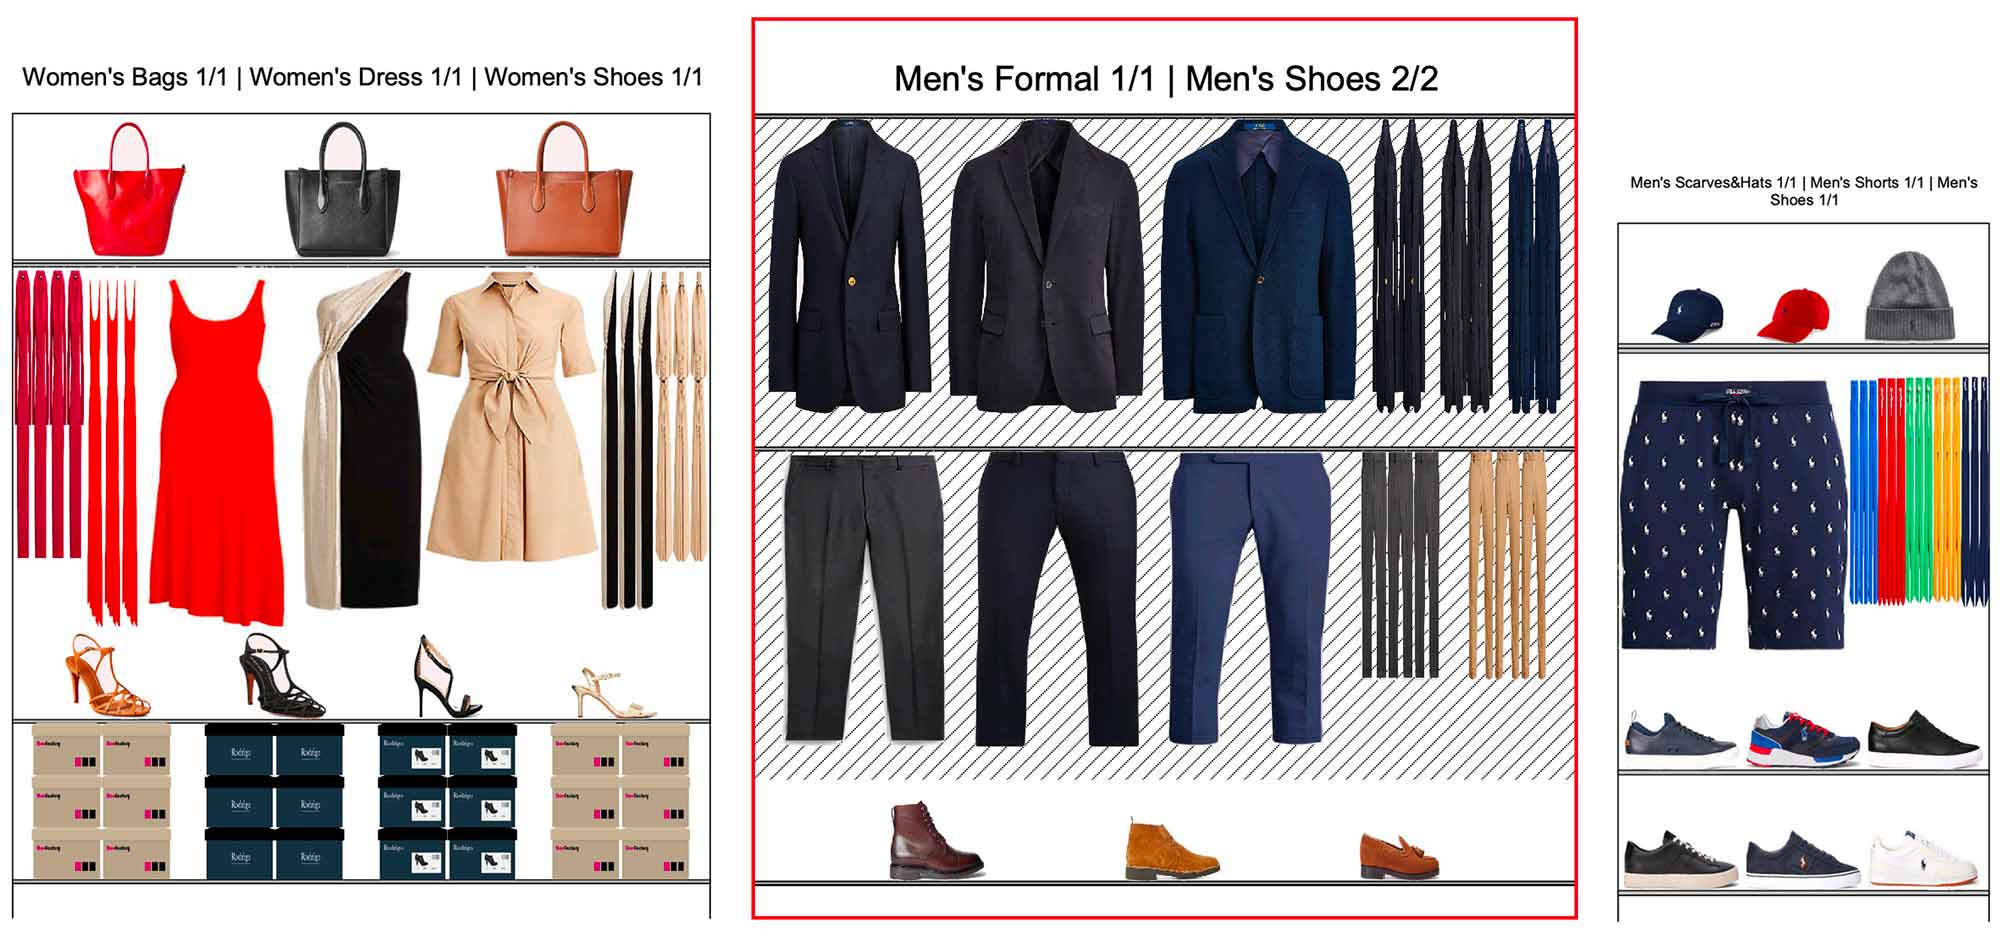
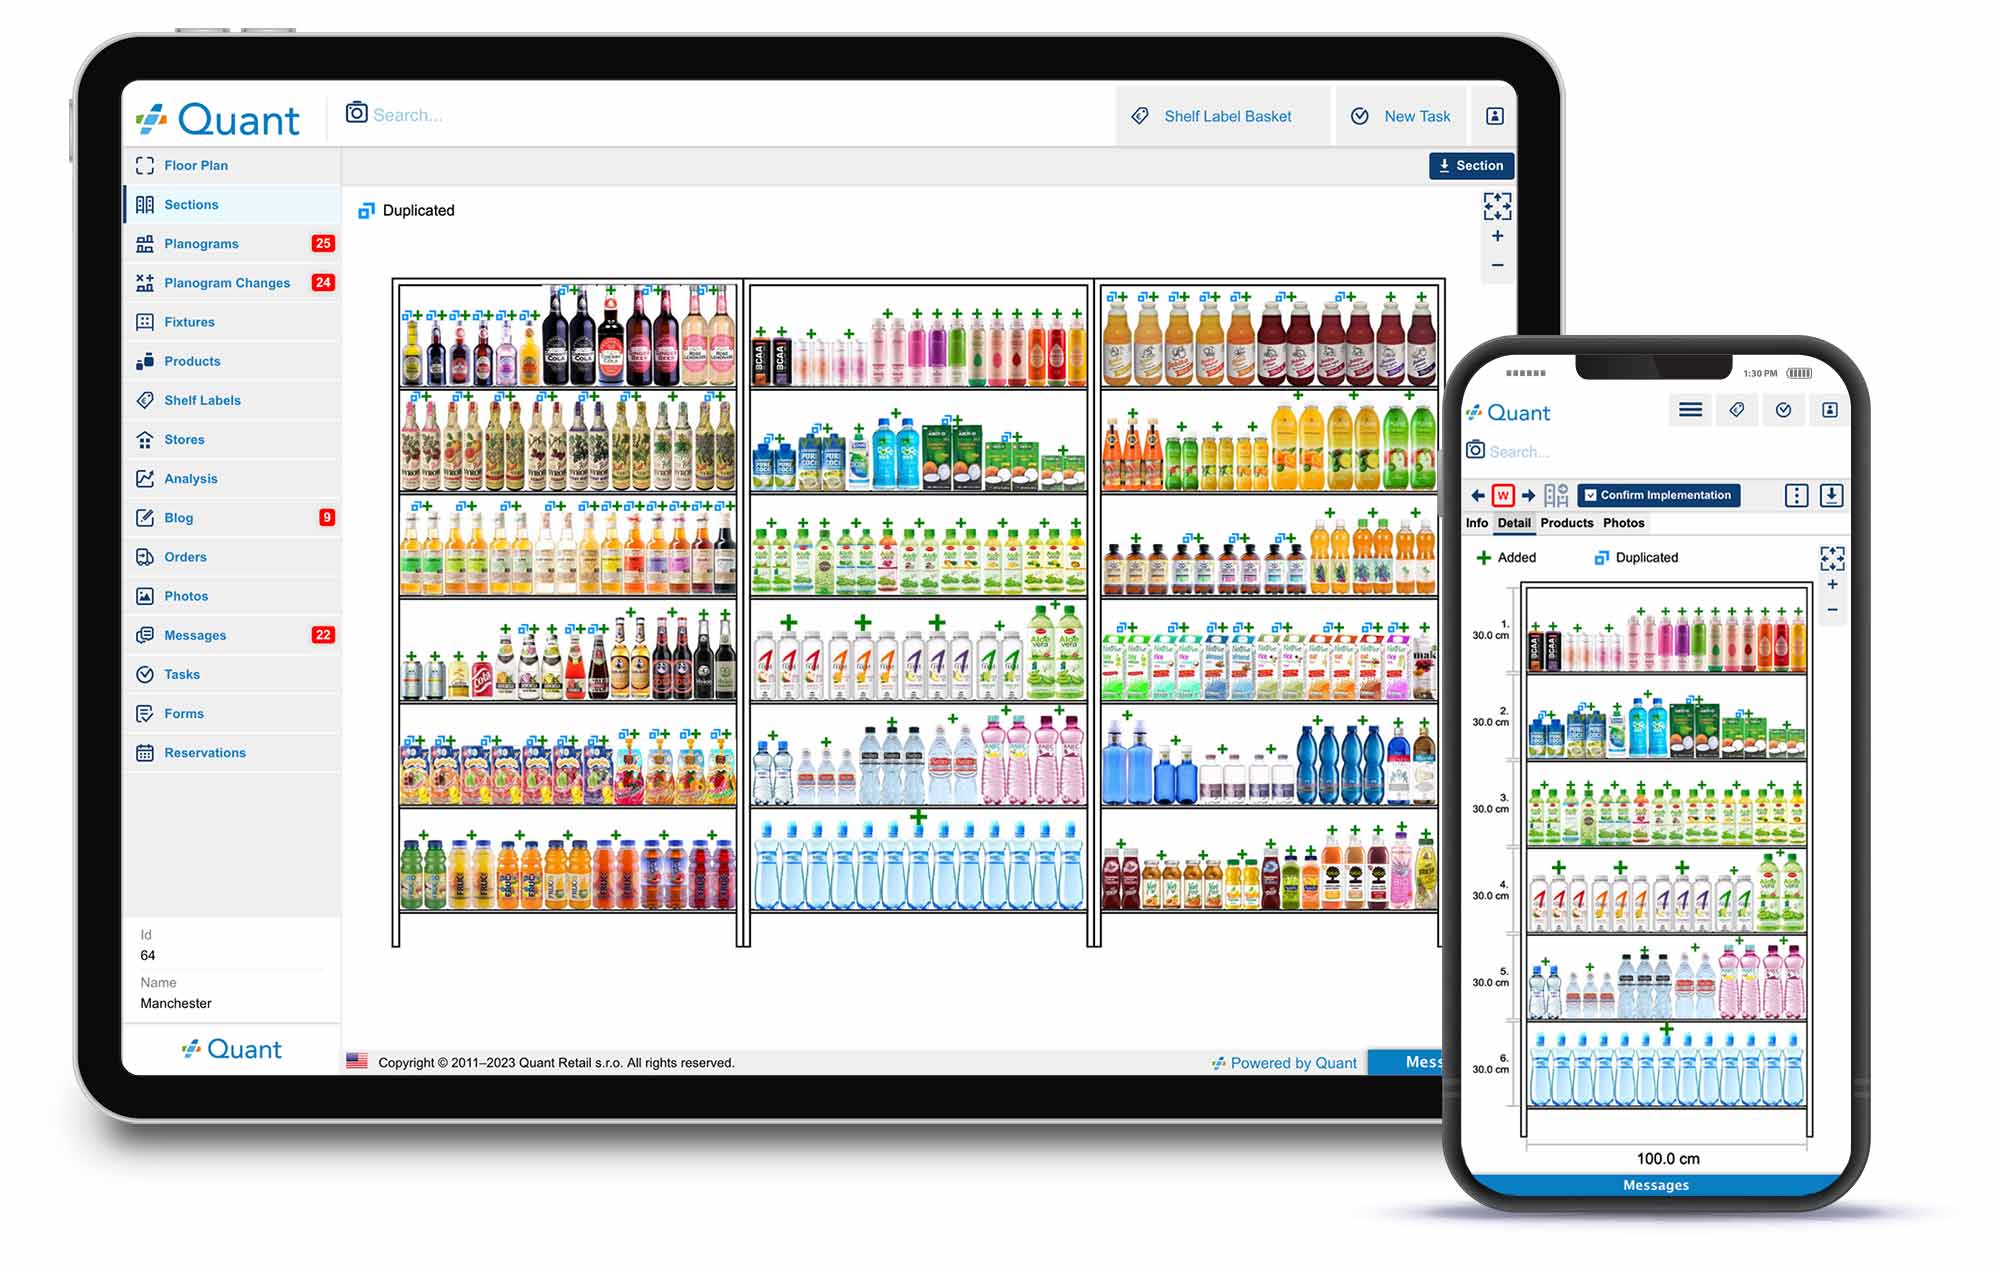
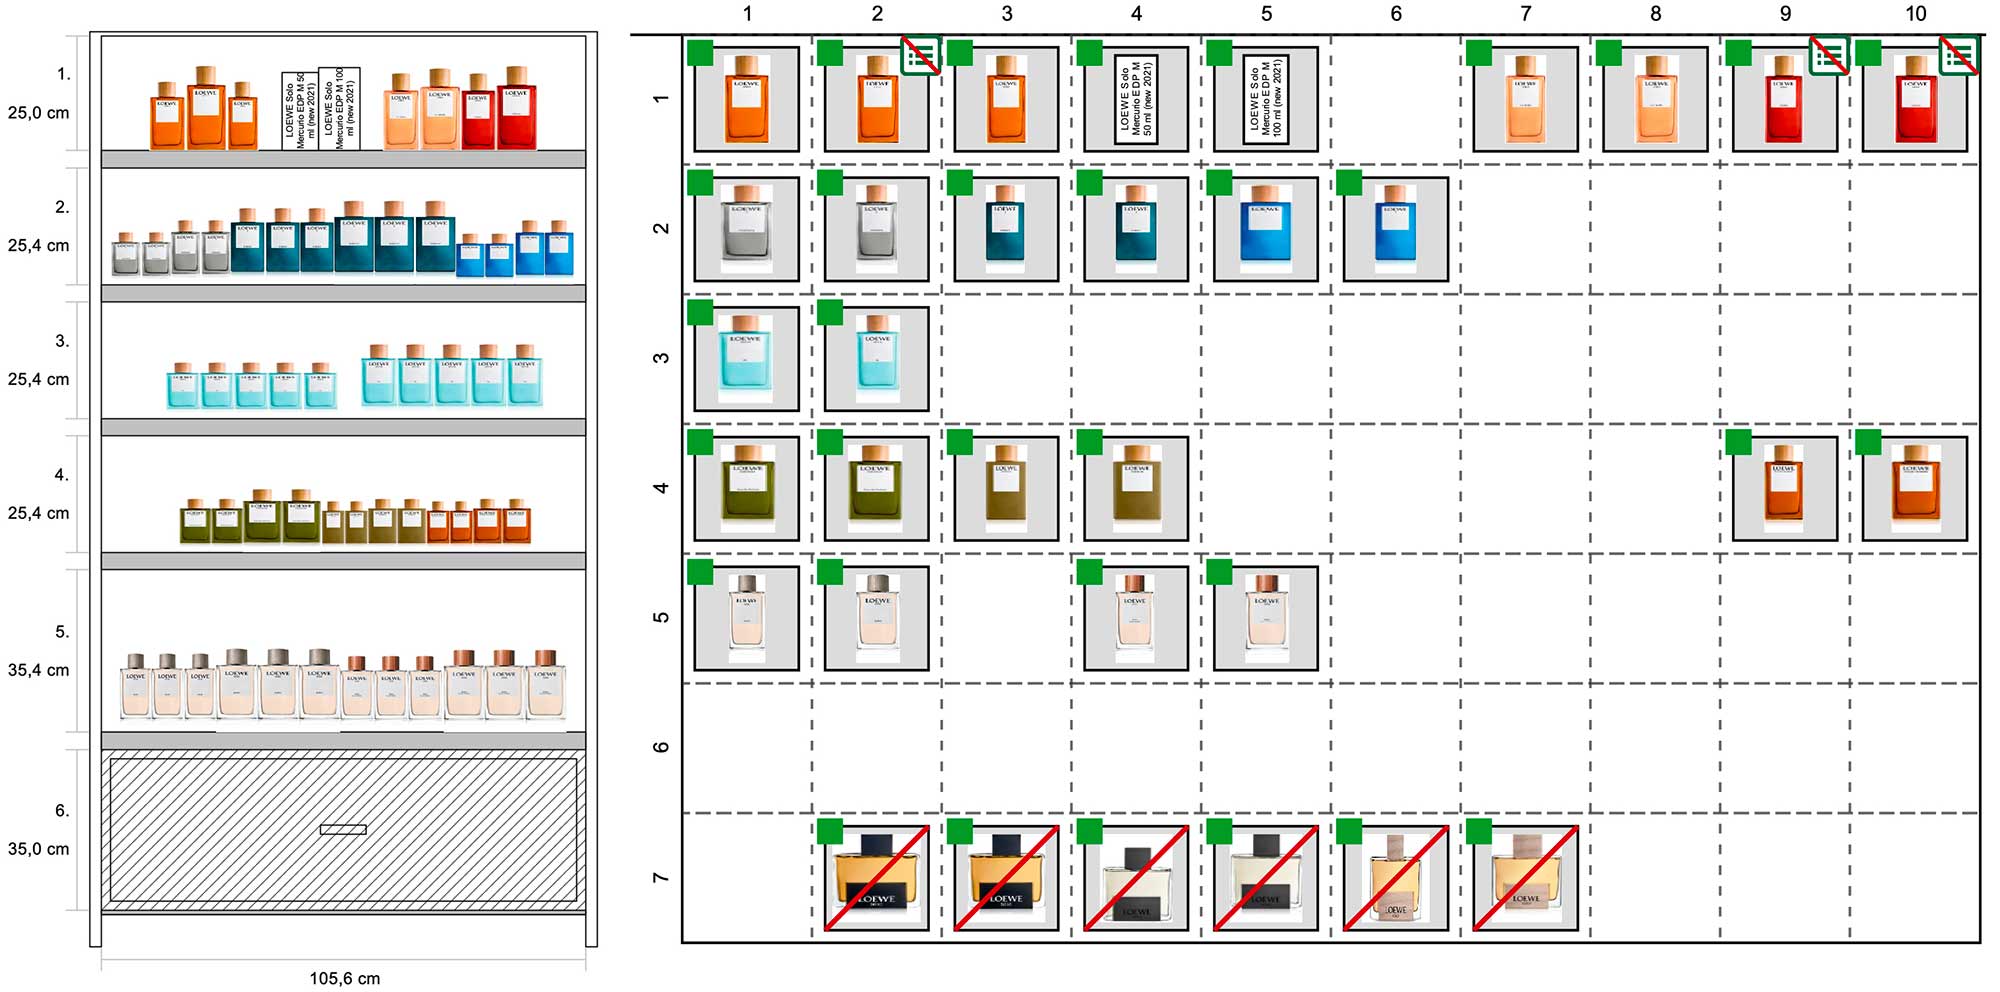
Planograms are a proven tool for preparing and implementing a good retail plan. Quant is a great software for creating planograms based on sales and space data. With Quant, you will be able to make the right decisions in the field of visual merchandising and thus increase sales and customer satisfaction.

Planogram Examples
“In the end, the result was more than 24% increase of total sales and 8% increase for OTC placed products.”
Katarina Milovanović / Category Manager
Dr.Max Serbia
Read more

Get acquainted with the benefits of Quant

Best value for money

Quant is a professional software for creating planograms at very affordable prices. As part of our practical pricing plans, we can offer a solution tailored to your needs, whether you are a small retailer, a multinational chain or a supplier.

Automatic planogram creation

Thanks to the unique concept of planogram templates, it is completely natural in Quant to automatically create planograms optimized according to sales, space and business criteria. Each store will receive planograms tailored to its layout with the number of articles corresponding to sales and logistics requirements.

Integrated solution

Quant Desktop allows you to solve not only micro space in the form of creating planograms but also macro space within one integrated, multi-user application thanks to the built-in management of store floor plans. However, this is just the beginning, with one click from Quant Desktop you can publish hundreds of planograms for your stores on the Quant Web.

Support for different fixture types

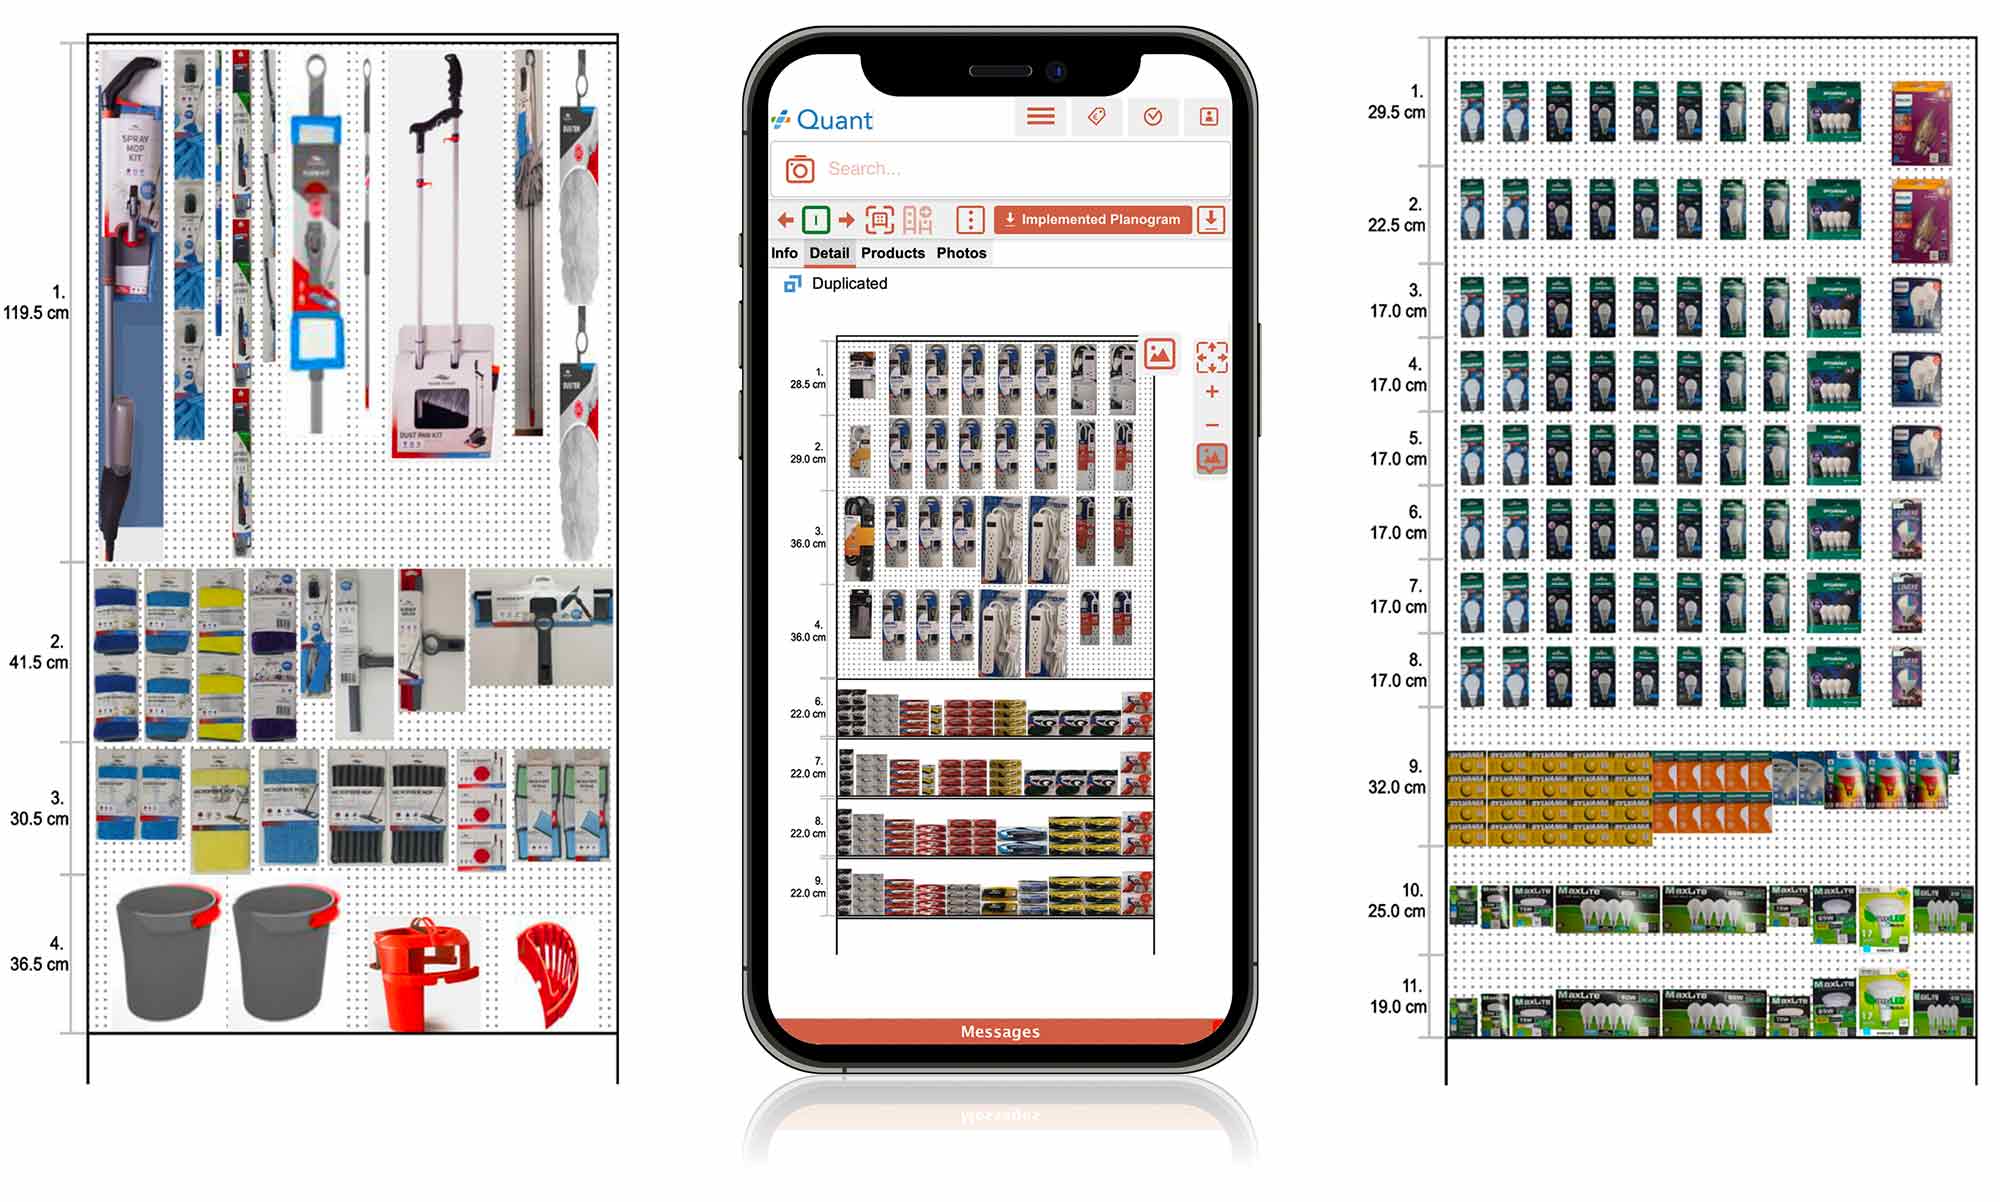
Quant supports various fixture types starting with classic shelving systems, through atypical gondolas, freezers, hanging systems, display on tables or pallets.

Performance visualization

Quant offers many visualization tools, planogram views as well as planogram performance which makes decisions on changes easier.

Easy to use and deploy

An intuitive user interface, an extensive set of online manuals, tutorial videos as well as direct user support are a guarantee that Quant will become a popular tool not only for new users but also for those with many years of experience with alternative software. Quant has one of the best user satisfaction ratings within the Retail Management Software category at G2.

Unlimited number of users

The Quant Premium pricing plan does not limit the number of users of the system and thus it encourages everyone within your organization to participate in the space & category management process. You will never have to face the dilemma of whether it pays off to use the possibilities of space planning software for the price of purchasing a license for other users.

Automatic data transfers

Thanks to the automation of data transfers between Quant and other company systems, you will save a lot of time and use the full potential of your data. It is possible to automatically send product and sales data, stock levels or prices to Quant. Because of that, Quant will enrich your ERP / BI systems with detailed information about product placement on store planograms. CSV / FTPS, RestAPI or replication SQL databases can be selected as the transfer technology.

Easy sharing and implementation control

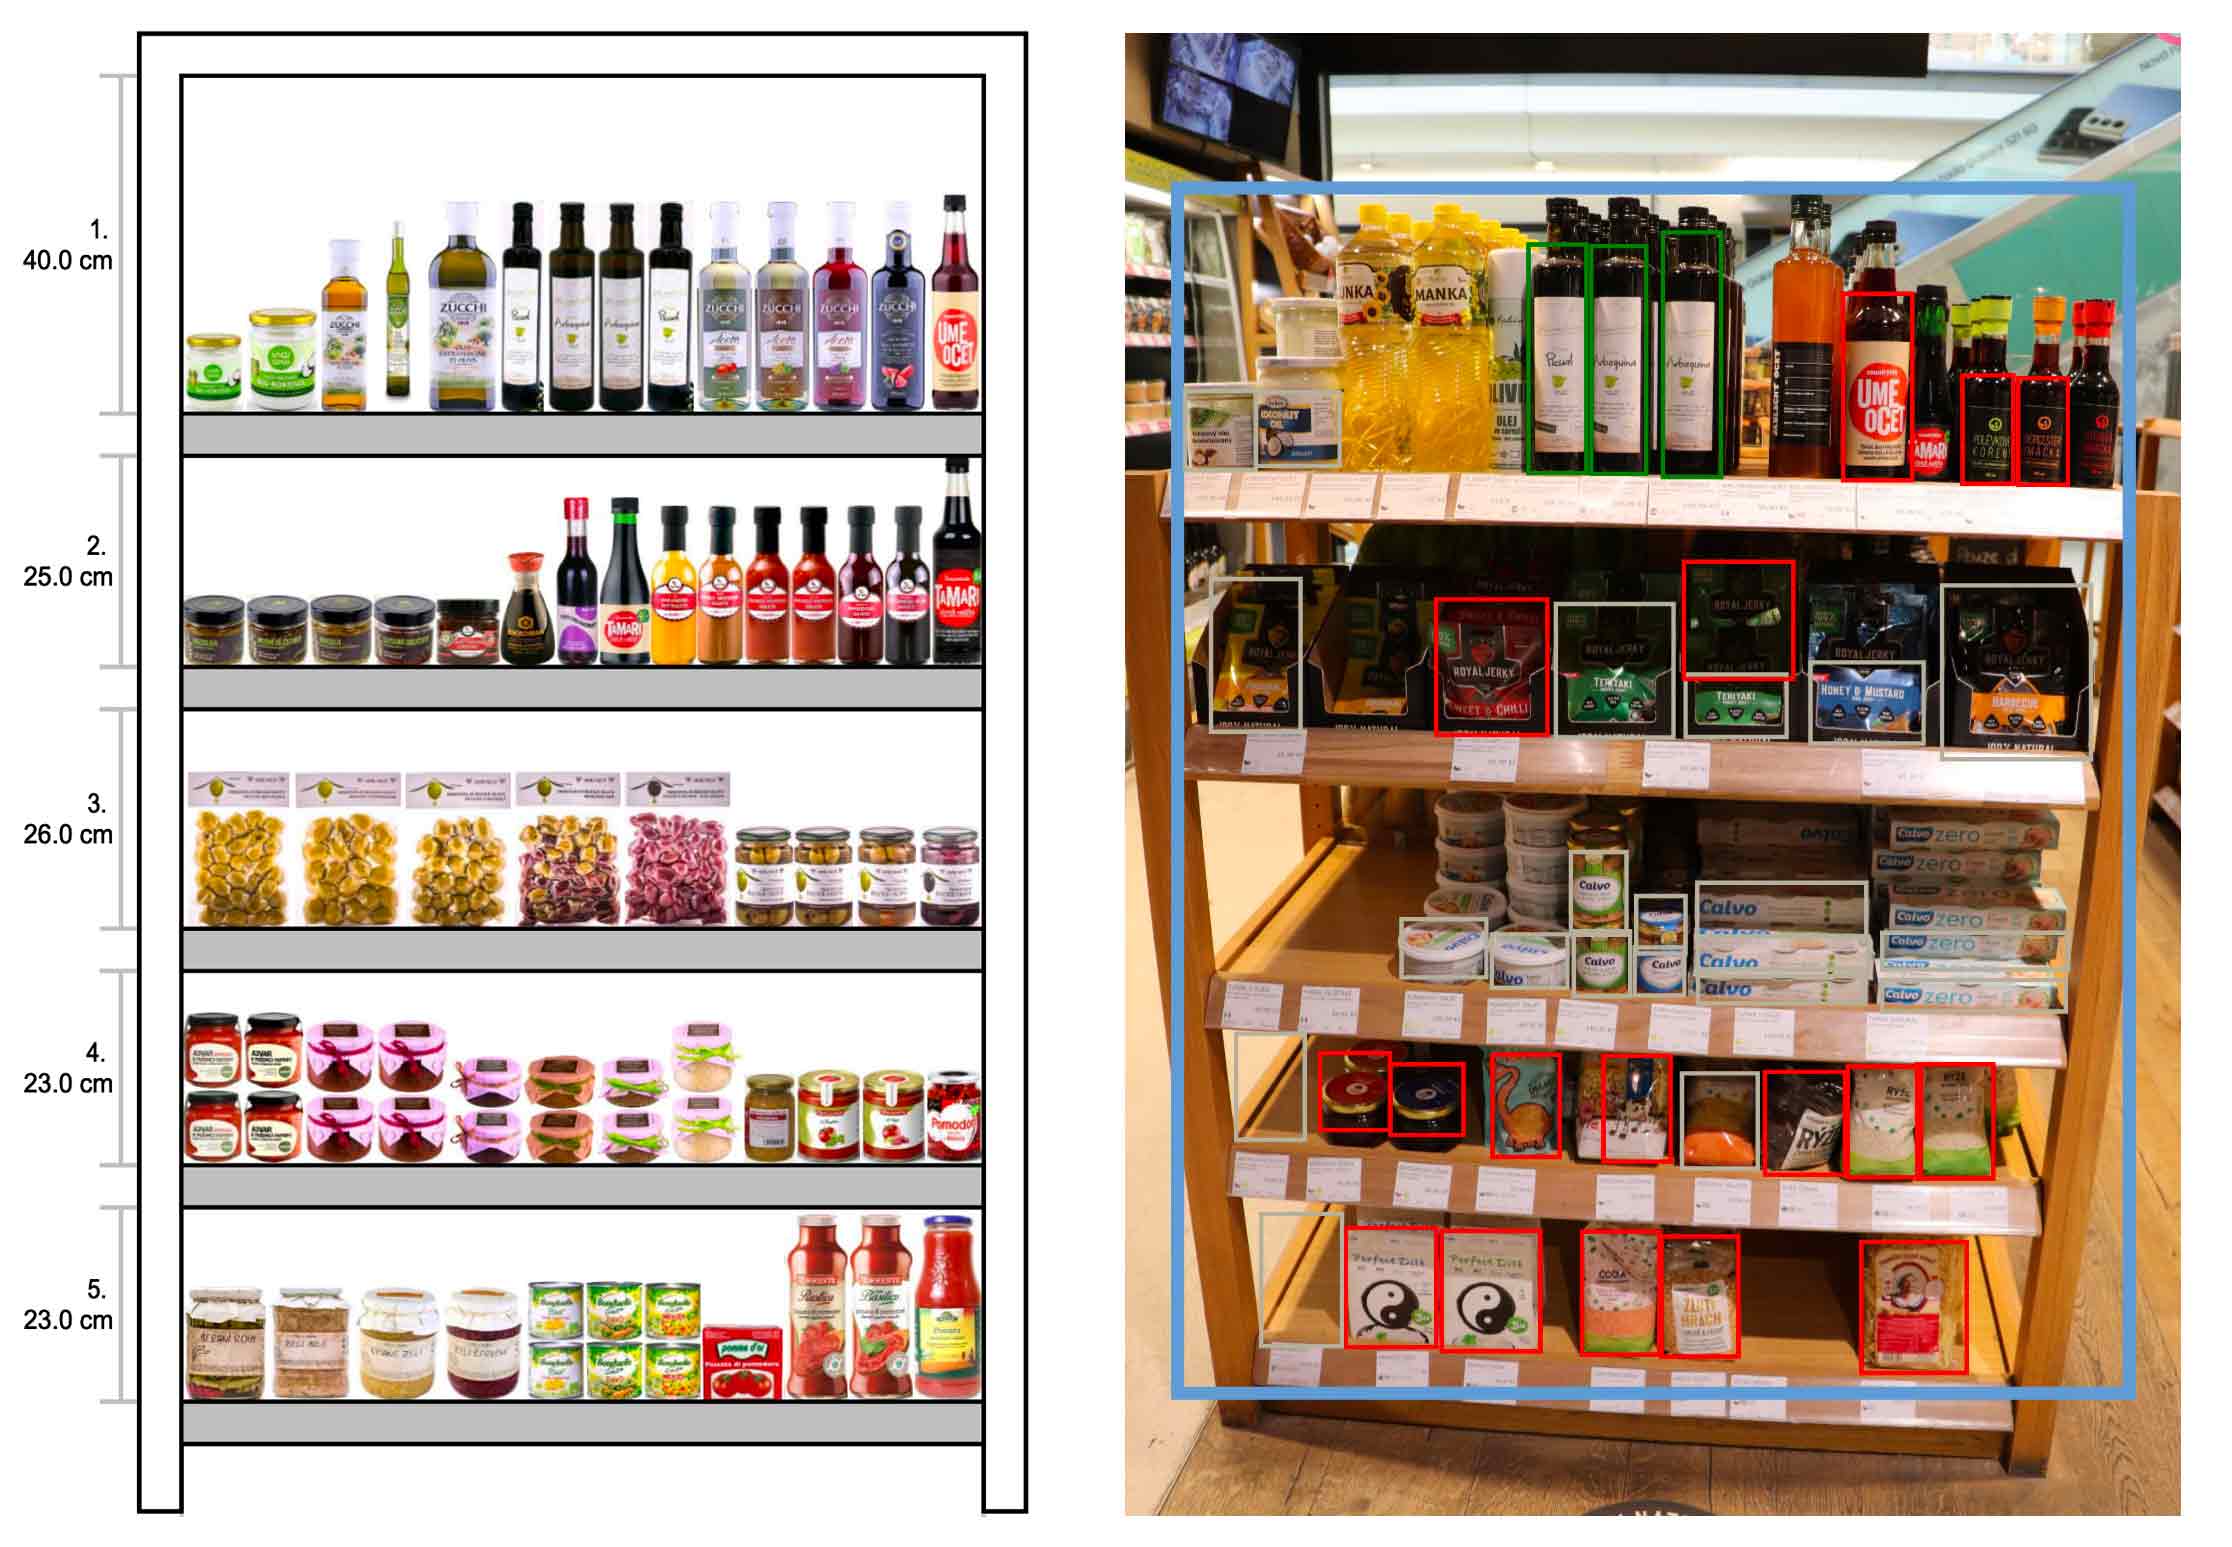
Each store has access to its specially made planograms via the Quant Web. Publishing new planograms is a matter of seconds. Quant automatically visualizes the differences between the old and the new planogram. The store confirms each implementation, including optional photo documentation which is then compared with the planogram by Quant's artificial intelligence.
“Today, we can create an individual planogram for every shelf, regardless of size, width and height, and for every store. Nothing is impossible and we know 100% which products are placed where. The informative value is relevant for all evaluations and is of utmost importance for future decisions. Local planograms can be created in this way and thus we can offer the customer on site a range of goods tailored to the location.”
Denis Schulz / Purchase & Procurement, Category Manager
BioCompany
Read more

Unique features that will excite you
Delta planograms

Delta Planograms

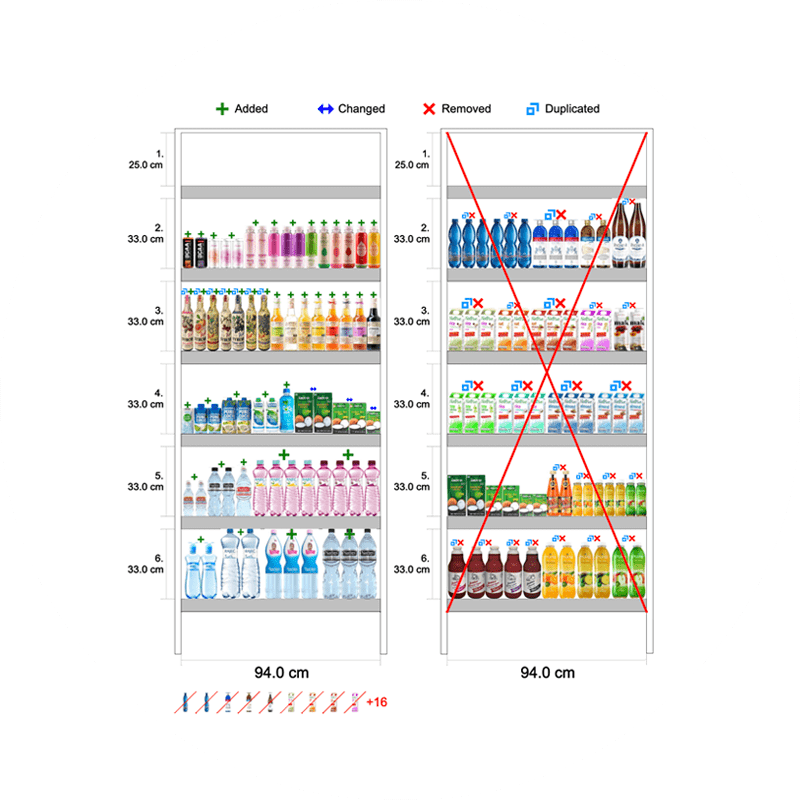
Quant‘s advanced life cycle management allows you to automatically detect and visualise differences between old and new planograms. Your store staff will greatly appreciate this feature and the speed of planogram implementation will markedly increase.

3D Visualisation

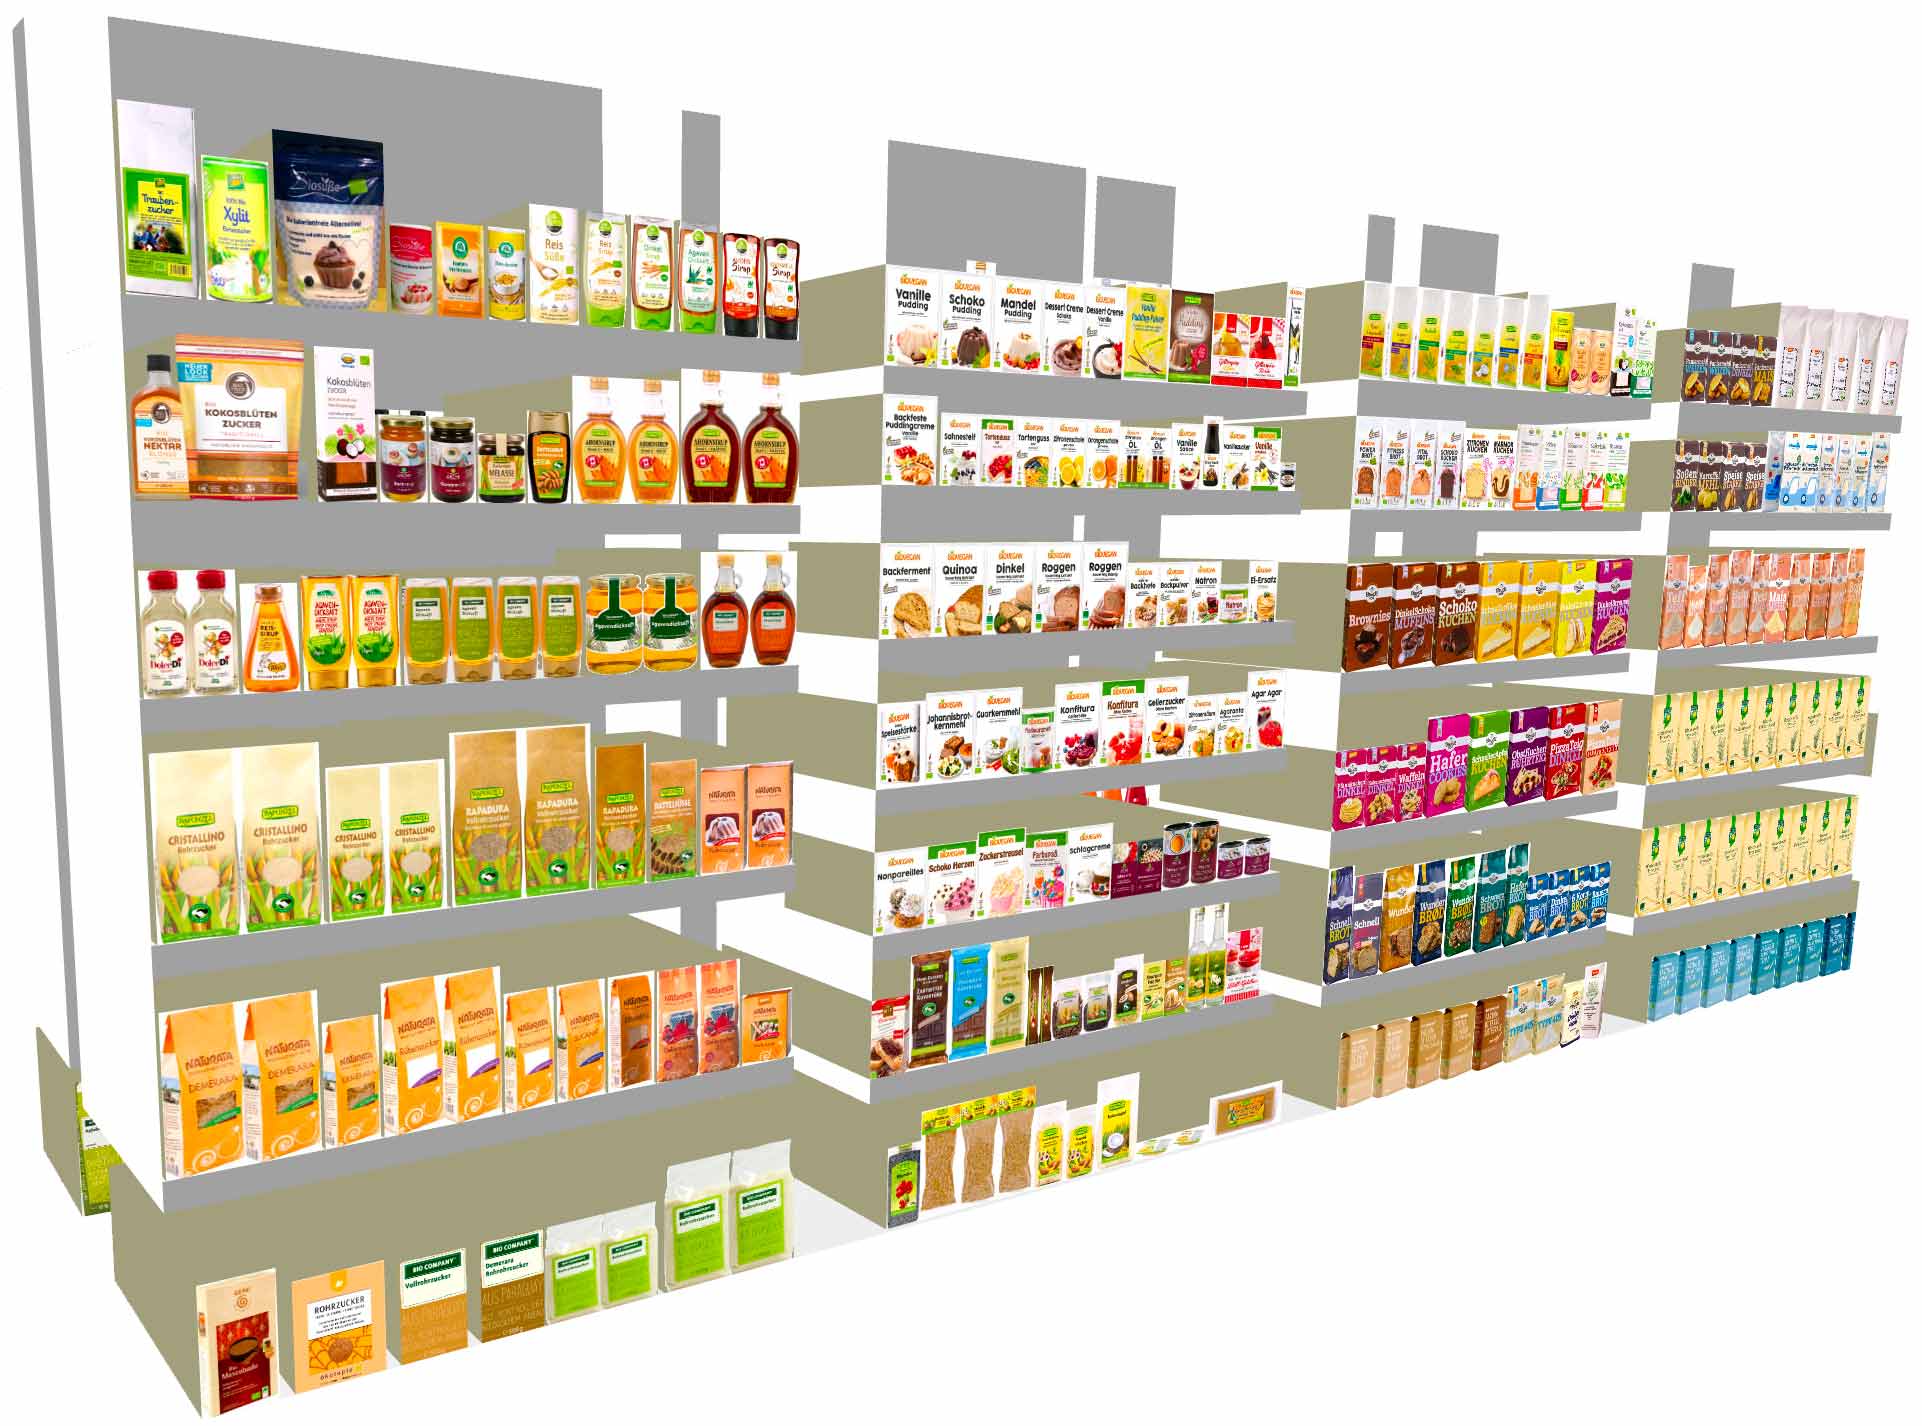
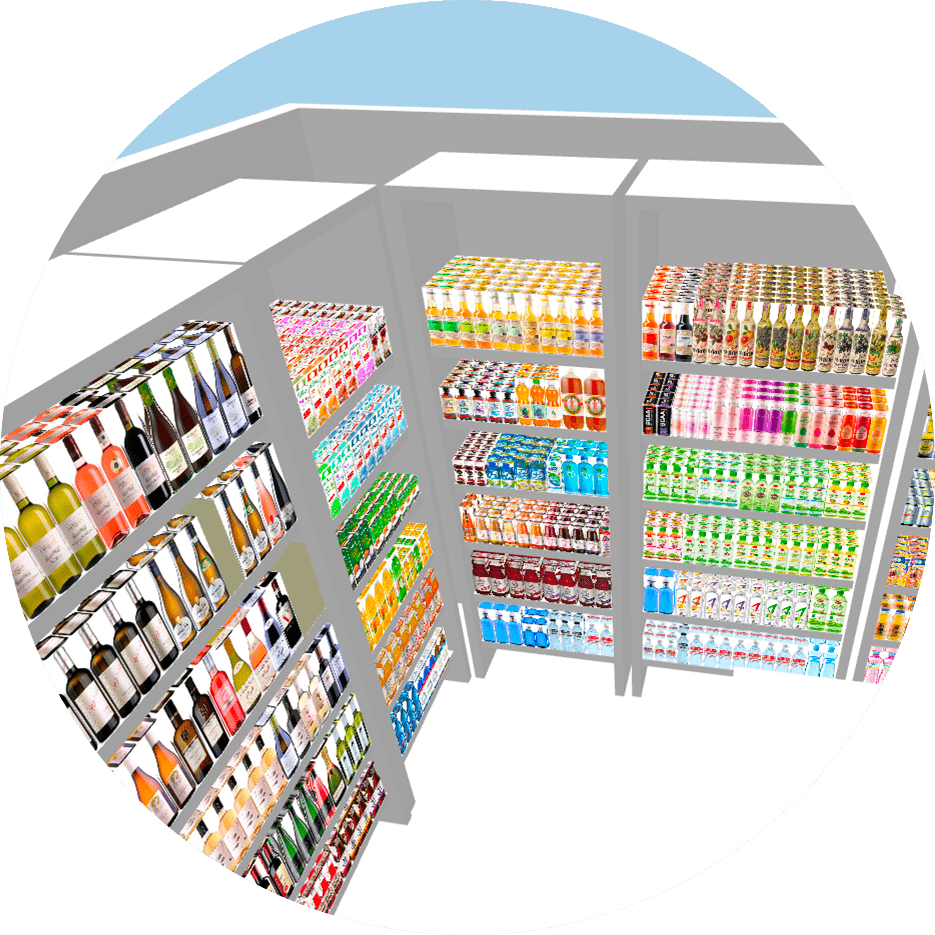
As well as superior performance in 2D, Quant also introduces you to the new world of 3D visualisation. View your store through your customers‘ eyes. Simply switch to 3D mode and take a virtual stroll through your store. Planograms can also be displayed as a 3D image. If you want to distribute a 3D planogram as a PDF file, just include it in the PDF settings.

Heat Maps / Labels

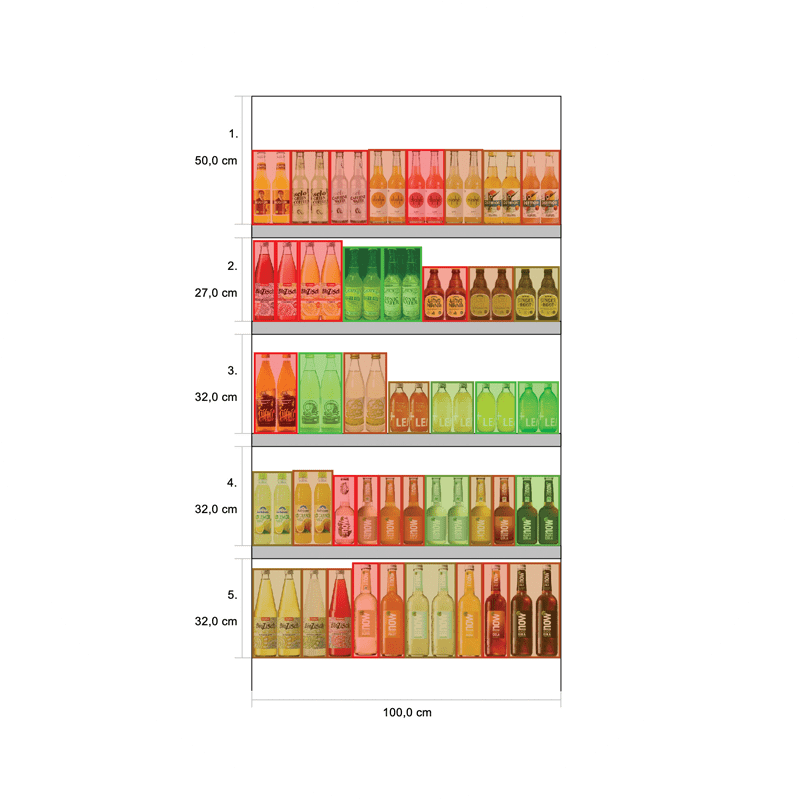
In addition to the standard visual planogram representation, Quant facilitates an analytical representation which displays product information relating to selected attributes and sales data. Heat maps reflecting the varying economic states of the products are a simple way to monitor product performance based on selected criteria.