Space Shares
The Space Shares analysis is primarily used for the comparison of space taken up by products belonging to selected categories in a specified store, and sales (profit, number of sold pieces or other sales data) that the products generate. Thanks to this analysis you can easily discover whether the category is underestimated or overestimated in terms of space assigned to it in planograms.
In what situation the Space Shares analysis can be used?
- If you wish to compare sales in a specified category and space that category takes up in planograms.
- The category is underestimated in terms of space – you can discover what products are not displayed at all or what products generate high sales and deserve larger space.
- The category is overestimated in terms of space – you can discover what products that are displayed have very low sales and you can consider their discarding from the planogram.
- If you wish to compare the sales of producers (or other product groups) in the given category and the space that is provided to them in planograms.
- The producer's products are underestimated in terms of space – you will get a list of the producer's most profitable products but also their products which are not on display.
- The producer's products are overestimated in terms of space – you will get a list of the producer's least profitable products and you can consider discarding such products from the planogram.
In this manual, you will find:
- How do you get a list of the best adepts for exclusion from the planogram when the category takes up too much space in the planograms due to its sales share?
- How do you get a list of products for which it would be worth to increase their planogram space because the given category brings you a big profit and would deserve more space in planograms?
Space Shares can be found in the Analysis – Space Shares menu.
Setting of criteria
At the beginning you have to set up analysis criteria based on which results will be presented.
Criteria that are not described in this manual can be found in the Basic Settings of Analyses manual.
Categories
Only the categories whose Space Share (Space) and Sales Share (GP1) that you wish to compare should be selected here.
Group by
This criterion is important for values displayed in the Product Groups tab and Product Groups in Categories tab. The attribute by which products in these two tabs should be grouped, is selected here. In this case, the Producer option has been selected, which means that selected categories will be divided into groups by their producers in the Product Groups tab.
Product Groups
When you click on this line, a window showing the values of the attribute that you have selected in the Group By line will open. In our case, all producers will be visible.
Delta Tolerance
In this line enter a number expressed as percentages that will show the difference between the sales share (Space) and space share (GP1) that should be highlighted. In the picture, we have selected Delta Tolerance 6 %, so any delta exceeding 6 % will be colour-highlighted.
Planogram State
In the Space Shares analysis always space in planograms is analysed. Therefore, the user has the option to select the lifecycle state of planograms in which the planograms will be analysed.
Categories Tab
In the Categories tab you can monitor the comparison of the space taken up by products in selected categories with their sales (with sold pieces, profile or other value set in the Value Type criterion).
- In the upper part, the graphic comparison of the space share and sales share is always provided.
- Under the graph, you can see the Categories table with specific values and calculated delta between the space spare and sales share.
- Upon clicking on certain categories in the Categories table, a table below in the Products in Selected Category section is displayed. Here all products belonging to the respective category are listed and can be arranged for example according to sales or profit to quickly find out what product from the given category is the least or most successful. Based on this, it is possible to evaluate what product should be eliminated from the planogram if the space share of the category is greater than its sales share, and vice versa for what product the number of its items in the planogram should be increased if the sales share is greater than its space share.
Graph
Graphic representation consists of two columns:
- The orange column – Space Share
- The blue column – Sales Share (GP1)
In the graph you can see that the categories Yoghurts and Milk are provided in the store more space than necessary according their sales. On the other hand, the categories Cottage Cheeses and Kefirs, Butters and Cheeses should be provided more space as their sales share is greater than the space one.
The Categories table 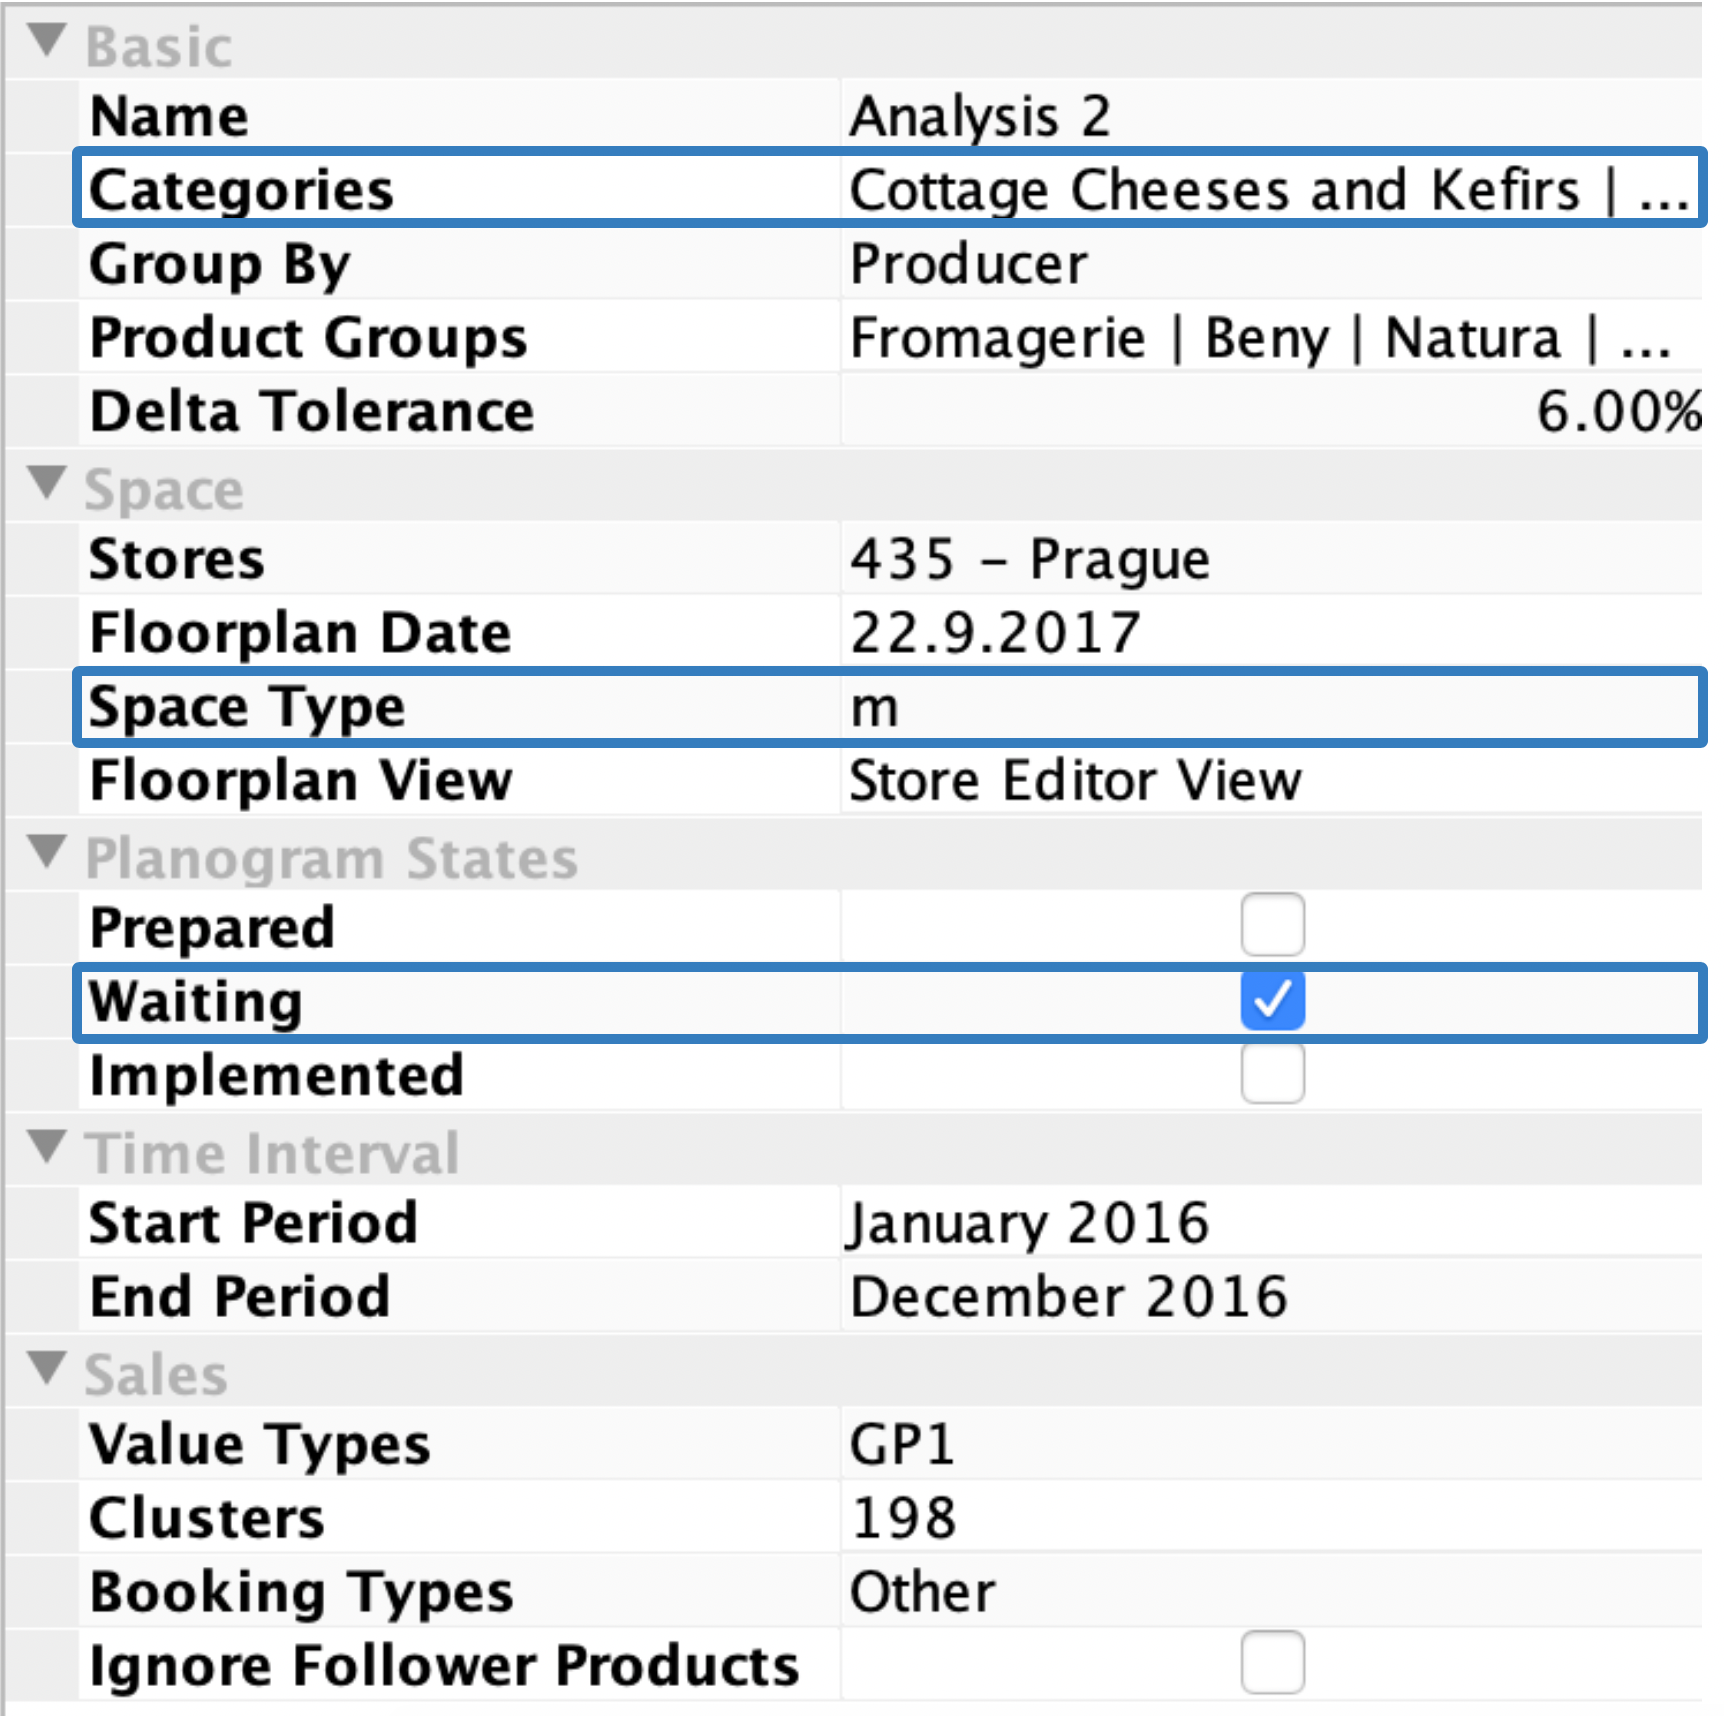 Criteria Analysis
Space
Shows space in m, m2 or m3 that products in the given category take up in planograms in the set lifecycle state in the selected stores.
All products in the Yoghurt category take up a total of 3.990 m in width in store Prague in the waiting planograms (see picture below).
The space type that should be calculated for planograms is selectedin the Space Type criterion (m, m2 or m3). Explanation of this criterion is provided in the help: Basic Settings of Analyses.
Space Share
The space expressed as percentages taken up by all products in the selected category in planograms in set lifecycle state in the selected stores compared to the total space taken up by products of all analysed categories in the set lifecycle state in the selected stores.
The space taken up by products belonging to the Yoghurt category in the waiting planograms into width (3.990 m) is divided by the space taken up by products belonging to the categories Cottage Cheeses and Kefirs, Yoghurts, Butters, Milk and Cheeses in the waiting planograms = 54.07 % (see the picture below).
The space taken up by products is calculated only for the products placed in planograms in the selected lifecycle state and only for planograms in the selected stores.
Sold Pieces / GP1
In this column always only the value that you have selected in the Sales / Value Type criteria is displayed.
The profit generated by products belonging to the Yoghurt category placed in the waiting planograms in the Prague store from January 2016 to December 2016 is CZK 585,990.
Sales share / GP1%
The share of the sales of all products in the given category currently placed in planograms in the selected stores within the set time interval is divided by the sales of products belonging to all analysed categories placed in planograms in the selected stores within the selected time interval. Only the planograms in the selected lifecycle state are analysed.
Profit generated by all products belonging to the Yoghurt category in waiting planograms from January 2016 to December 2016 (CZK 585,990) is divided by the profit of all analysed products (belonging to the following categories: Cottage Cheeses and Kefirs, Yoghurts, Butters, Milk and Cheeses) placed in the waiting planograms = 24.08 %.
The Sales are considered for the period of time that is selected in the Time Interval criteria and are calculated from sales data selected in the Clusters criterion.
Space % - GP1 %
Delta between the Space Share and Sales Share (GP1) columns. The calculation is done by deducting the value in the Sales Share (GP1) column from the value in the Space Share Column.
The Space Share of the Yoghurt category (54.07 %) – the Sales Share of the Yoghurt category (24.08 %) = 29.99 %.
Δ GP1
Δ GP1 shows how much space of each category is necessary to add or reduce to balance the space and sales shares.
Category Yoghurts is assigned by 2.213 m more space than it would deserve. It represents 29.99 % from the total space.
Quant calculates the space as well as sales of all products in the given category in all items of equipment. For example, a product belonging to the Yoghurt category will be calculated in the space of the Yoghurt category even in the case that it is placed in the equipment which has Milk category assigned.
The Products in Selected Category Table
The Products in Selected Category table refers to a list of all products belonging to the category that has been selected in the Categories table. This overview will help you to make a decision on products that should be added into / removed out of the planogram, products that are not present in the planogram at all, etc. Based on this information you will be able to optimize your planograms better.
In the following section two examples will be described:
Example 1 describes the situation where the space share is greater than the sales one and it is necessary to make a decision on what products should be eliminated from the planogram (low sales, few sold pieces, etc.).
Example 2 describes the situation where the sales share is greater than the space one and it is necessary to add some products into the planogram (for example those that are not placed at all or those that generate high profit).
The Space Share is greater than the Sales Share. Based on the results, the Yoghurts category is provided in the Prague store more space than it would deserve according to the generated profit. A logical step is to eliminate from the planograms the products that generate the lowest profit.
What to do?
- Arrange your products by profit GP1 (or other sales value that is of relevance to you) from the product with the lowest generated profit to the product with the highest generated profit.
- Filter only products placed in the waiting planograms (or belonging to another lifecycle state that you are analysing) from the Waiting – Space column. It makes no sense to consider eliminating products that are not placed in planograms.
- Left-click on the Waiting – Space columns in the place with the filter mark.
- Select the Custom option.
- Set the condition “is more than” value “0”.
The Sales Share is greater than the Space Share: The Cheeses category generates a high profit but doesn’t have assigned enough space in the waiting planograms. In this case, either for example products that are not included in the planograms at all, or those which are the most profitable should be added into the planograms.
What to do?
- Arrange your products according to profit from the most profitable ones to the least profitable ones.
- If you do not wish to add space to the already placed products and you only want to add new products to the planogram, use a filter for the Waiting – Space column and filter only products that are not placed.
- Left-click on the Waiting – Space columns in the place with the filter mark.
- Select the Custom option.
- Set the condition “equals” value “0”.
If you set this condition, the table will display only the products that are not placed in the waiting planograms. In addition, they will be arranged by profit from the most profitable ones to the least profitable ones so that the products in the first positions will be the candidates number one for placing in the planogram.
Product Groups Tab
In this tab, products are grouped by the Group By criterion. All groups of products that have been selected in the Product Groups criterion will be displayed here.
In our case the products are grouped by Producer. Based on results you can evaluate which producer generates the lowest profit with its products and which generates the highest one and whether the producer is provided sufficient space.
All products of the given producer are considered – i.e. also products that do not belong to categories set in the criteria.
Based on the analysis in the picture you can see that that the highest profit is generated by the Dr. Milk producer, nevertheless, it still has too much space assigned (by 4.40 % more than it should have). If you click on the Dr. Milk producer in the table below, all its products will be displayed. Product Comparison
Tab Product groups in categories
In this tab you can follow all possible combinations of categories and product groups.
In our case this means that each category that has been selected in the Categories criterion is combined with each producer selected in the Product Groups criterion. It is possible to monitor how the selected producers are doing in individual categories.