Top Products
The Top Products analysis allows the best-selling or profitable products to be monitored in selected stores. Lists of top products are generated based on criteria that you specify, for example products with the highest number of sold pieces or products generating the highest margin. In addition, the analysis will allow you to monitor the top groups of products (for example producers generating the highest profit in a given category etc.).
The Top Products analysis can be found in the Quant Explorer menu: Analyses – Top Products.
In what situation the Top Products analysis can be used?
- You wish to identify top products across all categories or in selected categories.
- You wish to acquire an overview of top product groups, for example groups by producers. Based on this analysis you can find out the producer generating the highest profit for you.
- You wish to find out whether all top products are placed in planograms.
- You need to have a list of best selling products in a certain store.
- Products that are assessed as top based on set criteria can be designated as “Planogramming” directly in the analysis.
 Top Products
Criteria
Categories
In this line, select only the categories the products of which you want to analyse. If you wish to have an overview of top products across all categories, select the All Products option.
Group By
In this criterion, select the attribute by which products will be grouped in the bottom table of the analysis. Grouping by producers or brands is widely used.
Number of Top Groups
The Number of Top Groups criterion affects the number of groups grouped by the attribute selected in the Group By criterion that will be seen in the bottom table on the left. Here, set the maximum number of top groups that you wish to be displayed in this table.
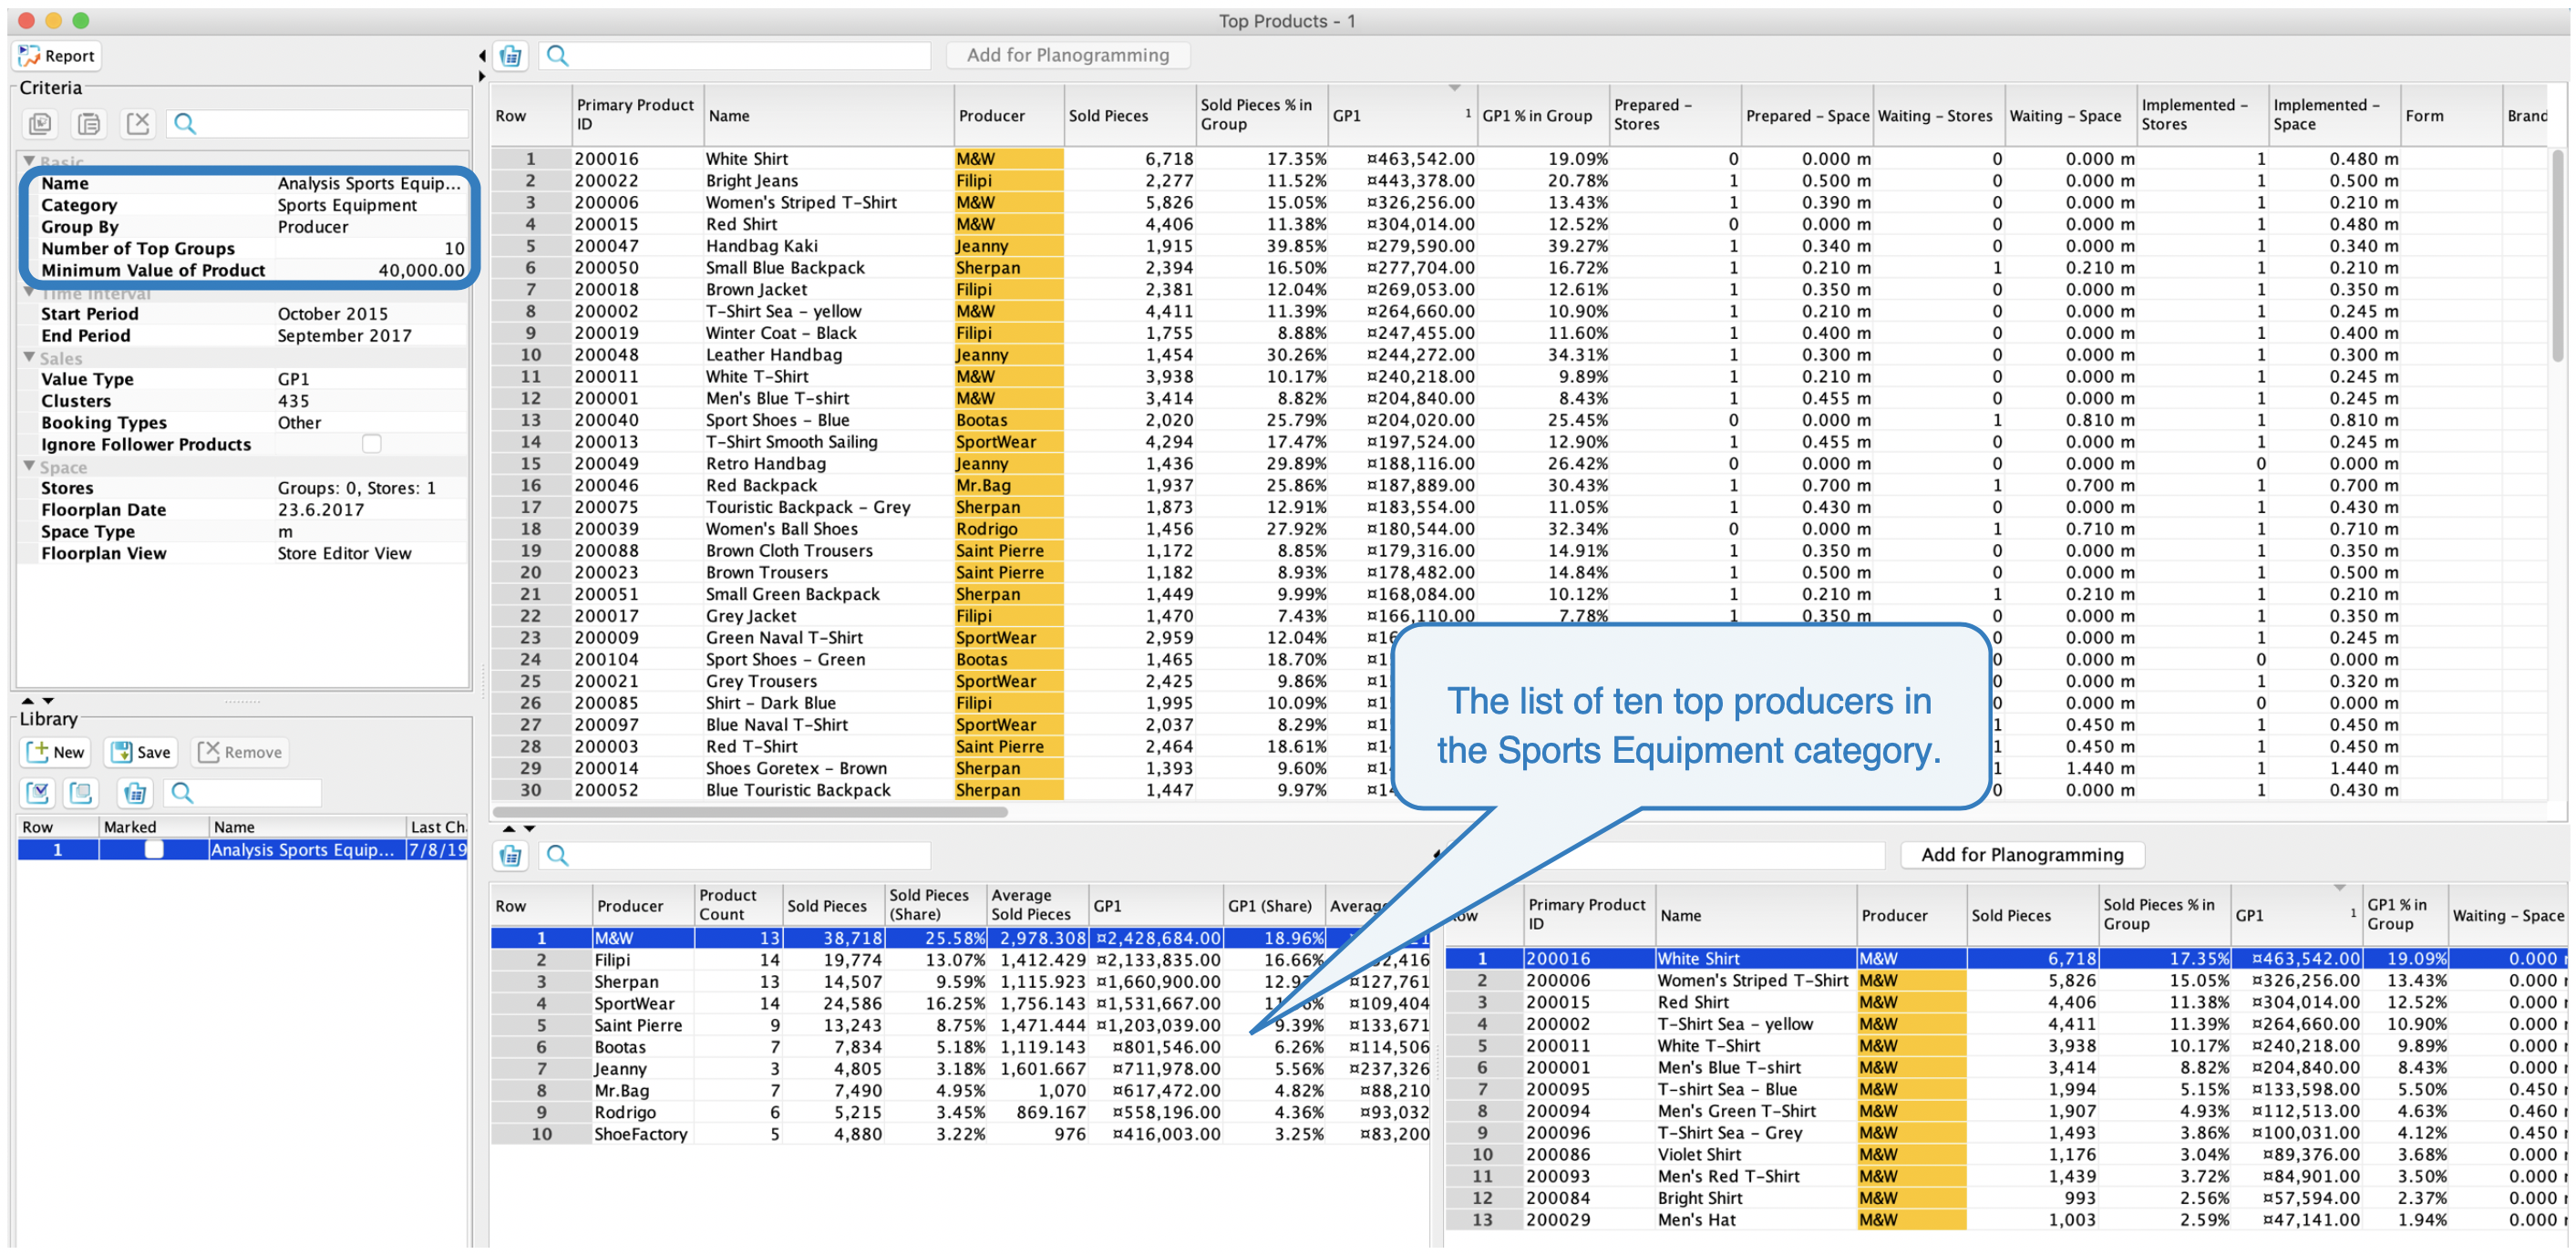
Let's analyse the Sports Equipment category. If the Producer option is selected in the Group By criterion and if the Number of Top Groups is 10, we can see in the bottom table on the left 10 top producers in the Sports Equipment category.
 Number of top groups
Minimum Value of Product
This criterion is related to the upper table where a list of top products based on set criteria is displayed. Here, you can set the lower limit for the value of the number of sold pieces, margins or other sales data selected in the Value Type criterion.
If you set GP1 in the Value Type criterion and the Minimum Value of Product is set at 40,000, this means that the upper table will show only products the margin of which is equal or higher than 40,000.
Value Type
In this criterion, the value according to which you wish to monitor product is to be selected. For example, if you wish to have a list of top products in terms of margins, select GP1 here.
Clusters
If you wish to have a list of top products for a specific store, it is necessary to select the store sales data here. However, the sales data of stores can be combined just as you wish. For example, you can analyse the sales data of stores in a specific region, etc.
Stores
In this criterion, select the stores the space of which you wish to be analysed. The analysis provides information on how much space is occupied by the respective product in planograms. For this reason, it is necessary to define space available for Quant. If you need to ascertain whether the top products of the store being analysed are used in planograms of the store concerned, select the same store in this criterion as that you have selected in the Clusters criterion.
Interpretation of the analysis
The analysis results are divided into three tables:
1. The upper table
In this table, a list of top products based on the selected value type (sold pieces, margin, etc.) is displayed. If you wish to see the products in the order from the best to the worst, you must arrange them in the table based on a value that you prefer (such as based on margin, number of sold pieces, etc.).
2. The bottom table on the left
In this table, products are grouped by the attribute selected in the Group By criterion. For example, if the Producer attribute is selected, you will see here the producer whose products generated the highest margin for you over the selected period. Again, the groups need to be arranged, for example by margin, if you wish their order to be displayed.
3. The bottom table on the right
In this table, all products belonging to the group selected in the bottom table on the left can be seen. If the products are grouped by producers, then all products provided by the producer selected in the table on the left are displayed in the table on the right. Again, products can be arranged, for example from the most profitable up to the least profitable ones.
Products that are assessed as top based on set criteria can be indicated as Planogramming directly in the analysis – this attribute must be selected in the product properties or otherwise the product will not be displayed in the Project Editor when planograms are created. A product can be add by selecting it in the table and clicking on the Add for Planogramming button.
Space assigned to products in published planograms
In the analysis tables, useful information concerning the placement of products in planograms can be obtained. The following section includes a description of columns concerning waiting planograms. The same interpretation can be applied to the already prepared or implemented planograms as well.
- Waiting – Space
This information says how much space is occupied by the selected product in all waiting planograms. In the Space Type criterion, you select whether only the space in widths (m), widths × height (m2) or width × height × depth (m3) is taken into account.
- Waiting – Stores
The number of stores where the product is placed in waiting planograms is concerned.
You need to ascertain whether the most profitable products are placed in waiting planograms in a specific store:
- Set the criteria to analyse only the store for which this information should be found out (the Clusters and Stores criteria).
- In the Waiting – Storescolumn, follow the product for which the value 0 and the product for which the value 1 is filled in:
- 0 = the product is not placed in the waiting planogram for the store
- 1 = the product is placed in the waiting planogram for the store
- Unplaced products may also be filtered using the optional filter “Waiting – Stores = 0”.
Sales information
Several columns in the tables are related to the sales of the respective product. For example, you can follow margin, number of sold pieces or other sales data that you upload to Quant. In the following section, columns concerning only GP1 (margin) will be covered but the same description can be applied to the other sales data as well.
- GP1
This specifies the value of the product margin for the set period. In the bottom table on the left, the value of margin for a whole group of products is concerned.
- The GP1 % group
A share expressed as percentage of the margin of the group to which this product belongs in on margins realized by all groups. This information is designated in the bottom table on the left as GP1(Share).
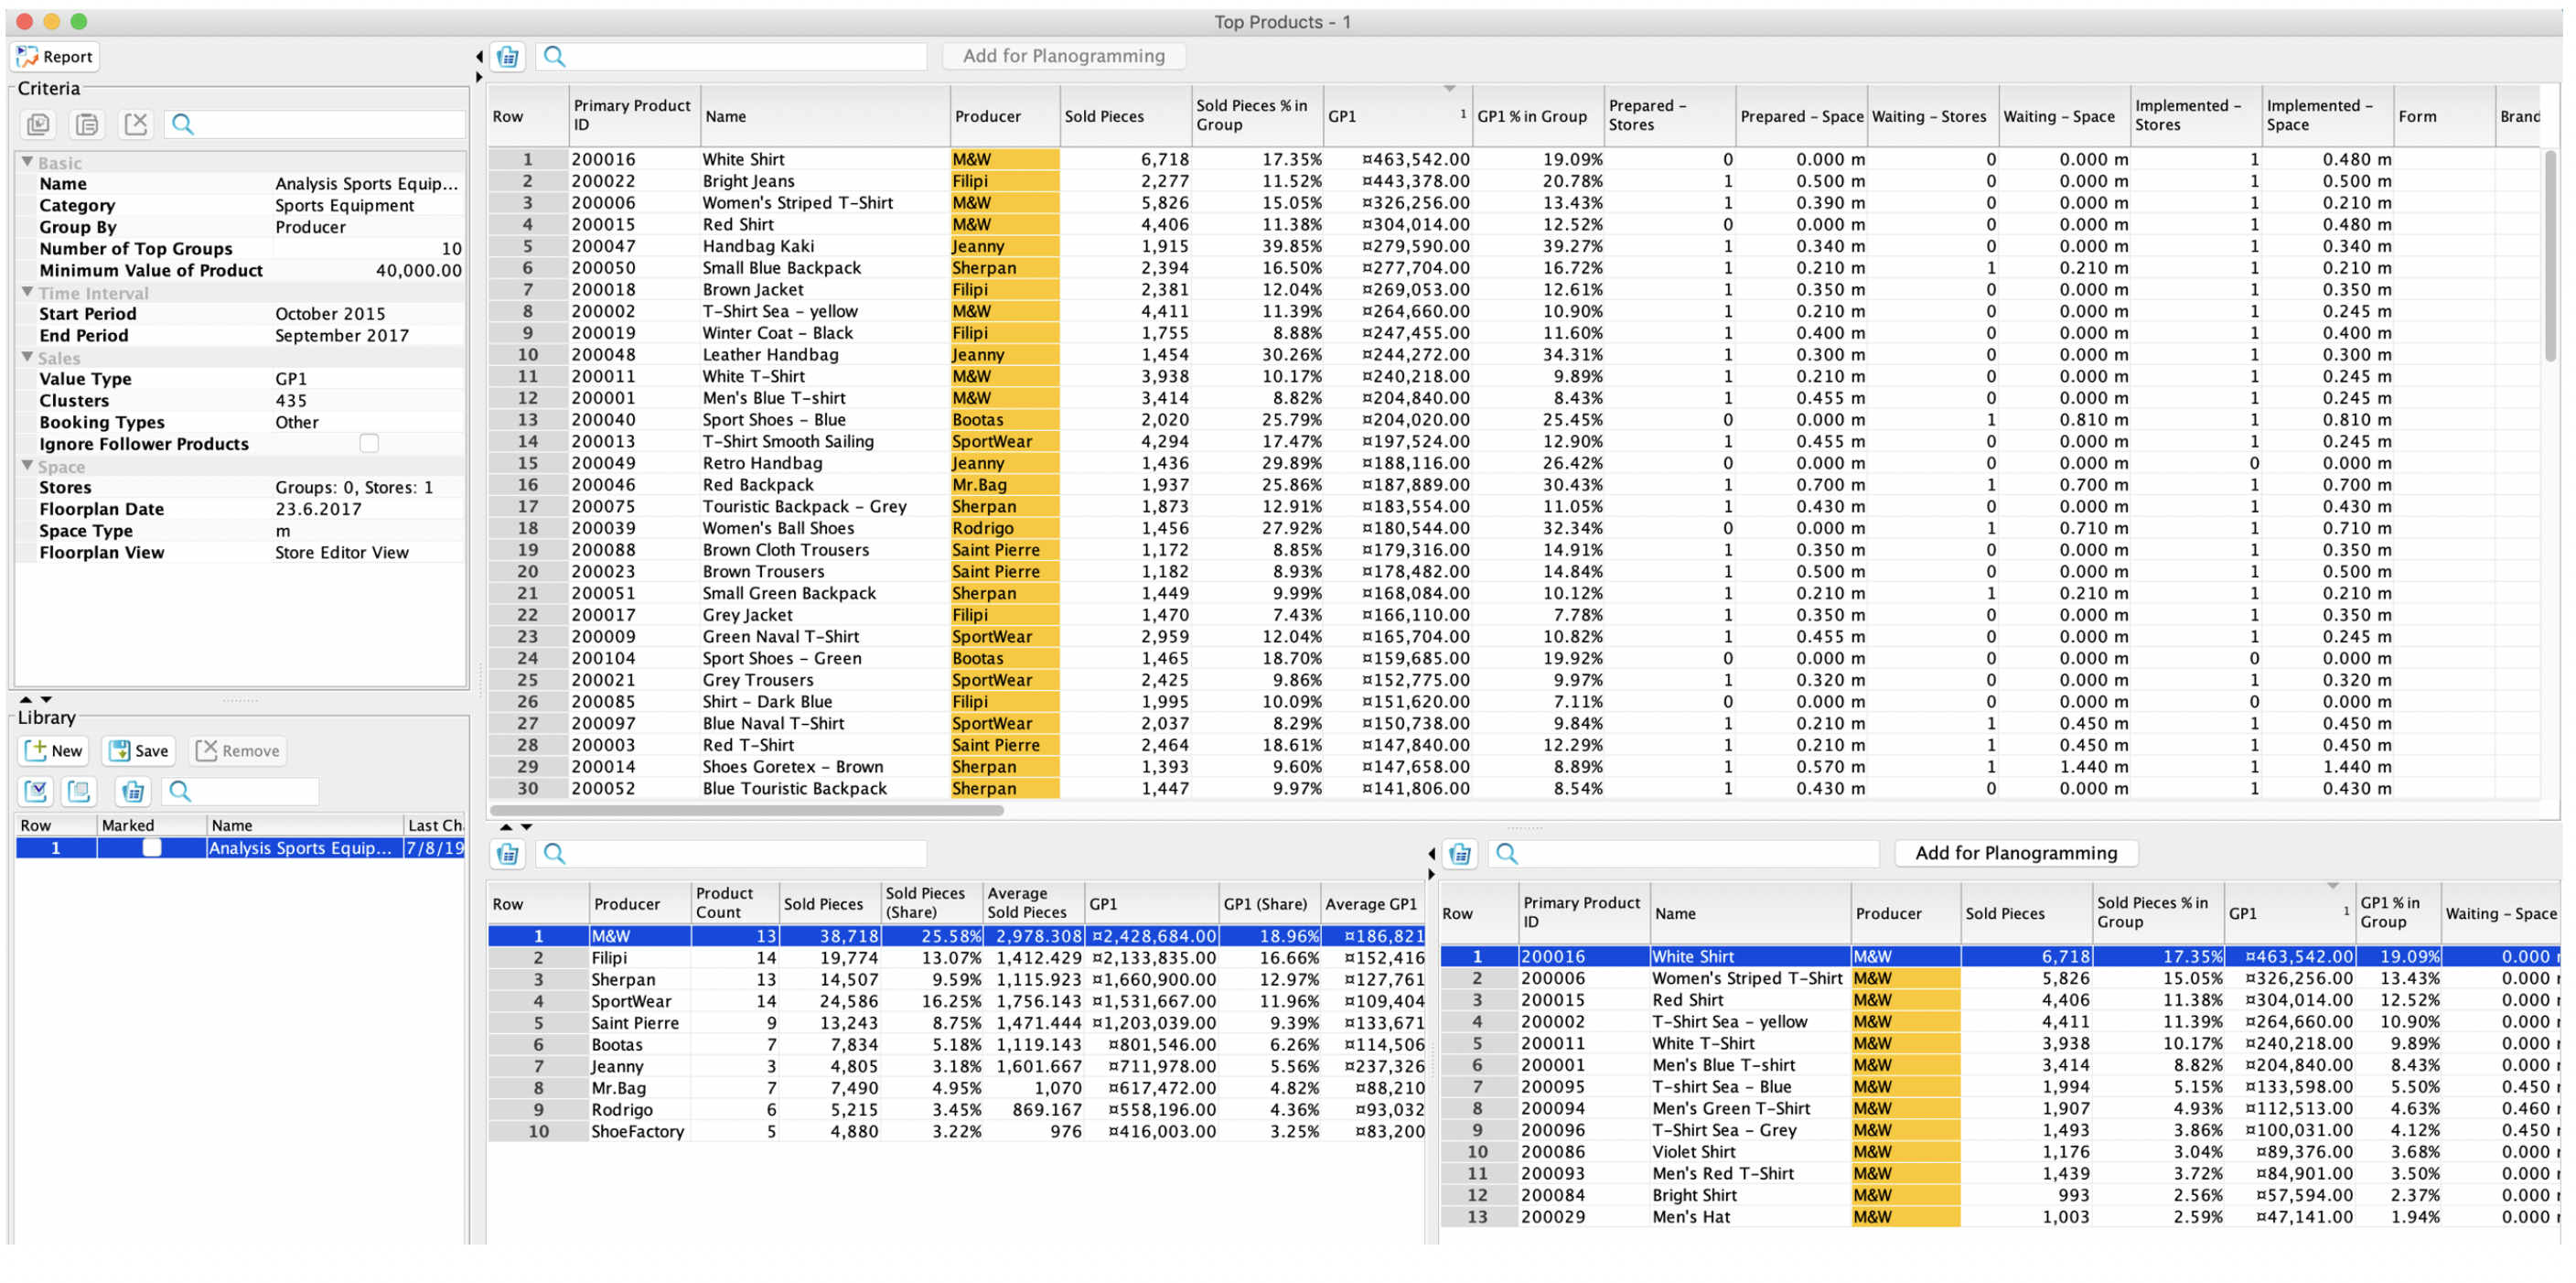
In the figure, it can be seen that for example the M&W producer contributed by 18.96% to the total margin over the period set in analysis.
- GP1 % in Group
A share expressed as percentage of the given product margins in the total amount of margins of the group to which the product belongs.
Product with ID 200016 in the figure contributes to the total amount of margins of the M&W producer by 19.09%.